\n
## Chart: Speedup vs. Number of Processing Elements
### Overview
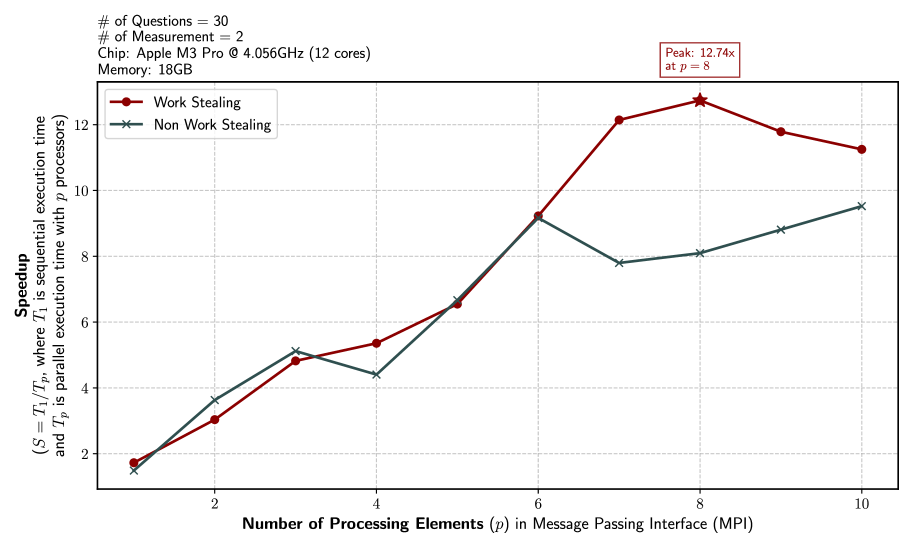
This chart depicts the speedup achieved by two different approaches – Work Stealing and Non-Work Stealing – as the number of processing elements (p) increases. The speedup is measured using Message Passing Interface (MPI). The chart provides performance data for a specific hardware configuration: Apple M3 Pro chip with 12 cores and 16GB of memory, across 30 questions and 2 measurements.
### Components/Axes
* **X-axis:** Number of Processing Elements (p) in Message Passing Interface (MPI). Scale ranges from 1 to 10, with markers at each integer value.
* **Y-axis:** Speedup, defined as S = T<sub>p</sub>/T<sub>1</sub>, where T<sub>1</sub> is sequential execution time and T<sub>p</sub> is parallel execution time with p processors. Scale ranges from 2 to 12, with markers at integer values.
* **Legend:** Located at the top-right of the chart.
* Red line with circular markers: Work Stealing
* Black line with cross markers: Non-Work Stealing
* **Metadata:** Located at the top-left of the chart.
* # of Questions = 30
* # of Measurement = 2
* Chip: Apple M3 Pro @ 4.056GHz (12 cores)
* Memory: 16GB
* **Peak Performance Indicator:** Located at the top-right of the chart.
* Peak: 12.74x at p = 8
### Detailed Analysis
**Work Stealing (Red Line):**
The Work Stealing line starts at approximately 1.7 speedup with 1 processing element. It exhibits a generally upward trend, with some fluctuations.
* p = 1: Speedup ≈ 1.7
* p = 2: Speedup ≈ 3.3
* p = 4: Speedup ≈ 5.0
* p = 6: Speedup ≈ 9.2
* p = 8: Speedup ≈ 12.7 (Peak)
* p = 10: Speedup ≈ 11.2
**Non-Work Stealing (Black Line):**
The Non-Work Stealing line also starts at approximately 1.7 speedup with 1 processing element. It shows a more gradual and consistent upward trend compared to Work Stealing.
* p = 1: Speedup ≈ 1.7
* p = 2: Speedup ≈ 3.0
* p = 4: Speedup ≈ 4.5
* p = 6: Speedup ≈ 7.5
* p = 8: Speedup ≈ 8.5
* p = 10: Speedup ≈ 9.5
### Key Observations
* Work Stealing consistently outperforms Non-Work Stealing across all tested numbers of processing elements.
* Work Stealing reaches its peak speedup of approximately 12.7x at 8 processing elements, after which it slightly decreases.
* Non-Work Stealing shows a steady increase in speedup as the number of processing elements increases, without reaching a clear peak within the tested range.
* Both methods start with a similar speedup at 1 processing element.
### Interpretation
The data suggests that Work Stealing is a more effective parallelization strategy than Non-Work Stealing for this specific workload (30 questions) on the given hardware (Apple M3 Pro). The significant speedup achieved by Work Stealing indicates that it efficiently distributes and manages tasks across multiple processing elements. The peak performance at 8 processing elements suggests an optimal balance between parallelization overhead and task distribution. The slight decrease in speedup beyond 8 processing elements could be due to increased communication overhead or diminishing returns from adding more processors. The consistent, but lower, performance of Non-Work Stealing suggests it may be less adaptable to dynamic task loads or less efficient in utilizing available processing resources. The fact that both start at the same speedup indicates that the initial overhead is similar, but the work stealing method is able to scale better.