## Pie Chart: Distribution of [Unspecified Category]
### Overview
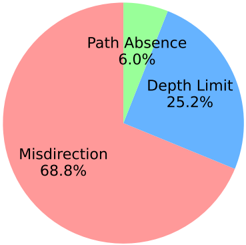
The image displays a pie chart divided into three segments, each representing a category with an associated percentage. The chart does not have an explicit title, so the subject matter (e.g., types of errors, failure modes, problem categories) is inferred from the labels. All text is in English.
### Components/Axes
* **Chart Type:** Pie Chart.
* **Segments & Labels:** The chart consists of three colored segments, each with a text label and a percentage value placed directly on or adjacent to the segment.
* **Legend:** There is no separate legend box; labels are integrated with the segments.
* **Spatial Layout:** The segments are arranged clockwise starting from the top.
### Detailed Analysis
The chart is segmented as follows, proceeding clockwise from the top:
1. **Segment 1 (Top, Green):**
* **Color:** Light green.
* **Label:** "Path Absence"
* **Value:** 6.0%
* **Position:** Occupies a small slice at the top of the chart.
2. **Segment 2 (Right, Blue):**
* **Color:** Light blue.
* **Label:** "Depth Limit"
* **Value:** 25.2%
* **Position:** A medium-sized slice on the right side of the chart.
3. **Segment 3 (Left & Bottom, Pink):**
* **Color:** Light pink/salmon.
* **Label:** "Misdirection"
* **Value:** 68.8%
* **Position:** The dominant slice, occupying the entire left side and bottom of the chart.
**Data Verification:** The sum of the percentages is 68.8% + 25.2% + 6.0% = 100.0%, confirming the chart represents a complete whole.
### Key Observations
* **Dominant Category:** "Misdirection" is the overwhelming majority, accounting for more than two-thirds (68.8%) of the total.
* **Secondary Category:** "Depth Limit" represents approximately one-quarter (25.2%) of the total.
* **Minor Category:** "Path Absence" is a relatively small factor, constituting only 6.0%.
* **Visual Hierarchy:** The size of the pink "Misdirection" segment immediately draws the eye, establishing it as the primary focus of the data.
### Interpretation
This pie chart illustrates the proportional distribution of three distinct categories within a whole. The data strongly suggests that **"Misdirection" is the primary or most frequent issue, cause, or component** within the context being measured, significantly outweighing the other two factors combined.
The relationship between the elements is one of part-to-whole, where "Depth Limit" and "Path Absence" are secondary and tertiary factors, respectively. The stark contrast between the 68.8% for "Misdirection" and the 6.0% for "Path Absence" indicates a highly skewed distribution. This could imply that efforts to address the overall problem should be prioritized towards understanding and mitigating "Misdirection," as it represents the largest potential area for impact. The chart effectively communicates that while "Depth Limit" is a notable contributor, "Path Absence" is a comparatively minor element in this specific dataset.