\n
## Line Chart: MSE vs. Pilot Size for Different Algorithms
### Overview
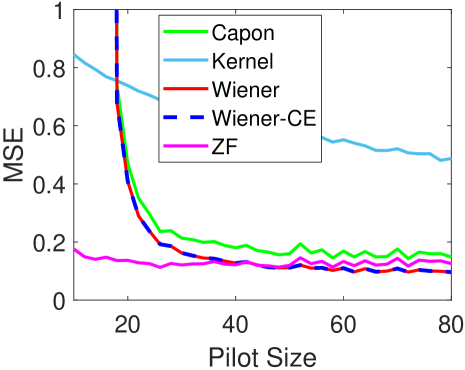
This image presents a line chart illustrating the relationship between Mean Squared Error (MSE) and Pilot Size for five different algorithms: Capon, Kernel, Wiener, Wiener-CE, and Zero-Forcing (ZF). The chart aims to compare the performance of these algorithms in terms of error reduction as the pilot size increases.
### Components/Axes
* **X-axis:** Pilot Size, ranging from approximately 0 to 80. The axis is labeled "Pilot Size".
* **Y-axis:** Mean Squared Error (MSE), ranging from 0 to 1. The axis is labeled "MSE".
* **Legend:** Located in the top-right corner of the chart. It identifies each line with a corresponding color:
* Capon (Green)
* Kernel (Light Blue)
* Wiener (Red)
* Wiener-CE (Dark Blue, dashed)
* ZF (Magenta)
### Detailed Analysis
The chart displays five distinct lines, each representing the MSE values for a specific algorithm across varying pilot sizes.
* **Capon (Green):** The line starts at approximately MSE = 0.22 at Pilot Size = 0, decreases to approximately MSE = 0.16 at Pilot Size = 20, and then plateaus around MSE = 0.16-0.18 for Pilot Sizes between 20 and 80.
* **Kernel (Light Blue):** This line exhibits a significant drop in MSE from approximately MSE = 0.85 at Pilot Size = 0 to approximately MSE = 0.55 at Pilot Size = 20. It then continues to decrease, but at a slower rate, reaching approximately MSE = 0.5 at Pilot Size = 80.
* **Wiener (Red):** The line begins at approximately MSE = 0.22 at Pilot Size = 0, rapidly decreases to approximately MSE = 0.12 at Pilot Size = 20, and then stabilizes around MSE = 0.12-0.14 for Pilot Sizes between 20 and 80.
* **Wiener-CE (Dark Blue, dashed):** This line starts at approximately MSE = 0.22 at Pilot Size = 0, decreases to approximately MSE = 0.13 at Pilot Size = 20, and then remains relatively constant around MSE = 0.13-0.15 for Pilot Sizes between 20 and 80.
* **ZF (Magenta):** The line starts at approximately MSE = 0.18 at Pilot Size = 0, decreases slightly to approximately MSE = 0.16 at Pilot Size = 20, and then remains relatively constant around MSE = 0.16-0.18 for Pilot Sizes between 20 and 80.
### Key Observations
* The Kernel algorithm initially exhibits the highest MSE, but shows a consistent decrease as the pilot size increases.
* The Wiener and Wiener-CE algorithms demonstrate the lowest MSE values, particularly at larger pilot sizes.
* The Capon and ZF algorithms show relatively stable MSE values across the entire range of pilot sizes.
* All algorithms show a significant reduction in MSE as the pilot size increases from 0 to 20. Beyond Pilot Size = 20, the rate of MSE reduction diminishes for all algorithms.
### Interpretation
The data suggests that increasing the pilot size generally leads to a reduction in MSE for all the tested algorithms. However, the extent of this reduction varies significantly depending on the algorithm used. The Wiener and Wiener-CE algorithms consistently outperform the others in terms of minimizing MSE, especially at larger pilot sizes. The Kernel algorithm, while starting with a high MSE, shows a substantial improvement with increasing pilot size. The Capon and ZF algorithms provide relatively stable performance, but their MSE values are generally higher than those of the Wiener-based algorithms.
The rapid decrease in MSE from Pilot Size = 0 to Pilot Size = 20 indicates that the initial increase in pilot size has the most significant impact on error reduction. Beyond this point, the benefits of increasing the pilot size become less pronounced. This suggests that there may be a diminishing return on investment in terms of pilot size beyond a certain threshold. The differences in performance between the algorithms likely stem from their underlying assumptions and methodologies for signal estimation and interference cancellation.