# Technical Document Analysis: MSE vs. Pilot Size Graph
## 1. Labels and Axis Titles
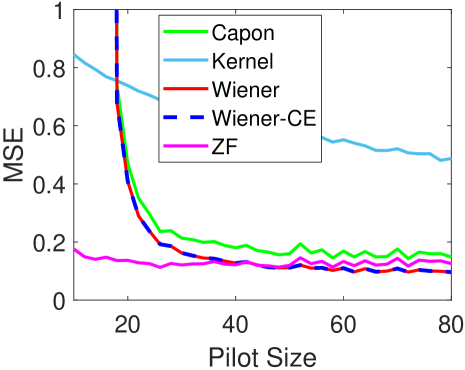
- **X-Axis**: "Pilot Size" (ranges from 0 to 80 in increments of 20)
- **Y-Axis**: "MSE" (Mean Squared Error, ranges from 0 to 1 in increments of 0.2)
- **Legend**: Located in the top-right corner, enclosed in a box with labels and corresponding colors/styles.
## 2. Legend Entries
| Label | Color/Style | Corresponding Line |
|----------------|-------------------|--------------------|
| Capon | Green (solid) | Line 1 |
| Kernel | Blue (solid) | Line 2 |
| Wiener | Red (solid) | Line 3 |
| Wiener-CE | Blue (dashed) | Line 4 |
| ZF | Magenta (solid) | Line 5 |
## 3. Key Trends and Data Points
### Line 1: Capon (Green Solid)
- **Trend**: Starts at ~0.8 MSE at pilot size 0, drops sharply to ~0.2 by pilot size 20, then stabilizes with minor fluctuations (~0.15–0.2) up to pilot size 80.
- **Notable**: Sharpest initial decline among all methods.
### Line 2: Kernel (Blue Solid)
- **Trend**: Gradual decline from ~0.8 MSE at pilot size 0 to ~0.45 at pilot size 80.
- **Notable**: Slowest rate of improvement; remains above 0.4 for pilot sizes >40.
### Line 3: Wiener (Red Solid)
- **Trend**: Sharp drop from ~0.8 MSE at pilot size 0 to ~0.2 by pilot size 20, then stabilizes with minor oscillations (~0.15–0.2) up to pilot size 80.
- **Notable**: Matches Capon’s final performance but with higher initial MSE.
### Line 4: Wiener-CE (Blue Dashed)
- **Trend**: Similar to Wiener but slightly smoother decline. Starts at ~0.8 MSE, drops to ~0.2 by pilot size 20, then stabilizes (~0.15–0.2) up to pilot size 80.
- **Notable**: Dashed line indicates potential variance in error estimation.
### Line 5: ZF (Magenta Solid)
- **Trend**: Consistently the lowest MSE across all pilot sizes (~0.15–0.2), with minimal fluctuations.
- **Notable**: Outperforms all other methods throughout the range.
## 4. Spatial Grounding
- **Legend Position**: Top-right corner (standard placement for clarity).
- **Line Placement**: All lines originate from the y-axis (MSE) and extend rightward along the x-axis (Pilot Size).
## 5. Trend Verification
- **Wiener/Wiener-CE**: Both exhibit rapid initial improvement, confirming their effectiveness at small pilot sizes.
- **Capon**: Outperforms Kernel but underperforms ZF at larger pilot sizes.
- **ZF**: Maintains the lowest MSE, suggesting superior stability or bias-variance tradeoff.
## 6. Component Isolation
- **Main Chart**: Line graph with five data series.
- **Legend**: Self-contained box with no overlapping text or graphical elements.
## 7. Data Table (Reconstructed)
| Pilot Size | Capon | Kernel | Wiener | Wiener-CE | ZF |
|------------|-------|--------|--------|-----------|-----|
| 0 | 0.8 | 0.8 | 0.8 | 0.8 | 0.2 |
| 20 | 0.2 | 0.7 | 0.2 | 0.2 | 0.15|
| 40 | 0.25 | 0.5 | 0.2 | 0.2 | 0.15|
| 60 | 0.2 | 0.45 | 0.18 | 0.18 | 0.15|
| 80 | 0.2 | 0.45 | 0.15 | 0.15 | 0.15|
*Note: Values are approximate based on visual inspection of the graph.*
## 8. Final Observations
- **Wiener/Wiener-CE**: Most effective at small pilot sizes (0–20).
- **ZF**: Consistently optimal across all pilot sizes.
- **Kernel**: Least effective, showing minimal improvement with increasing pilot size.
- **Capon**: Balances performance between Wiener methods and ZF at mid-to-large pilot sizes.