## Sankey Diagram: Build Status Flow
### Overview
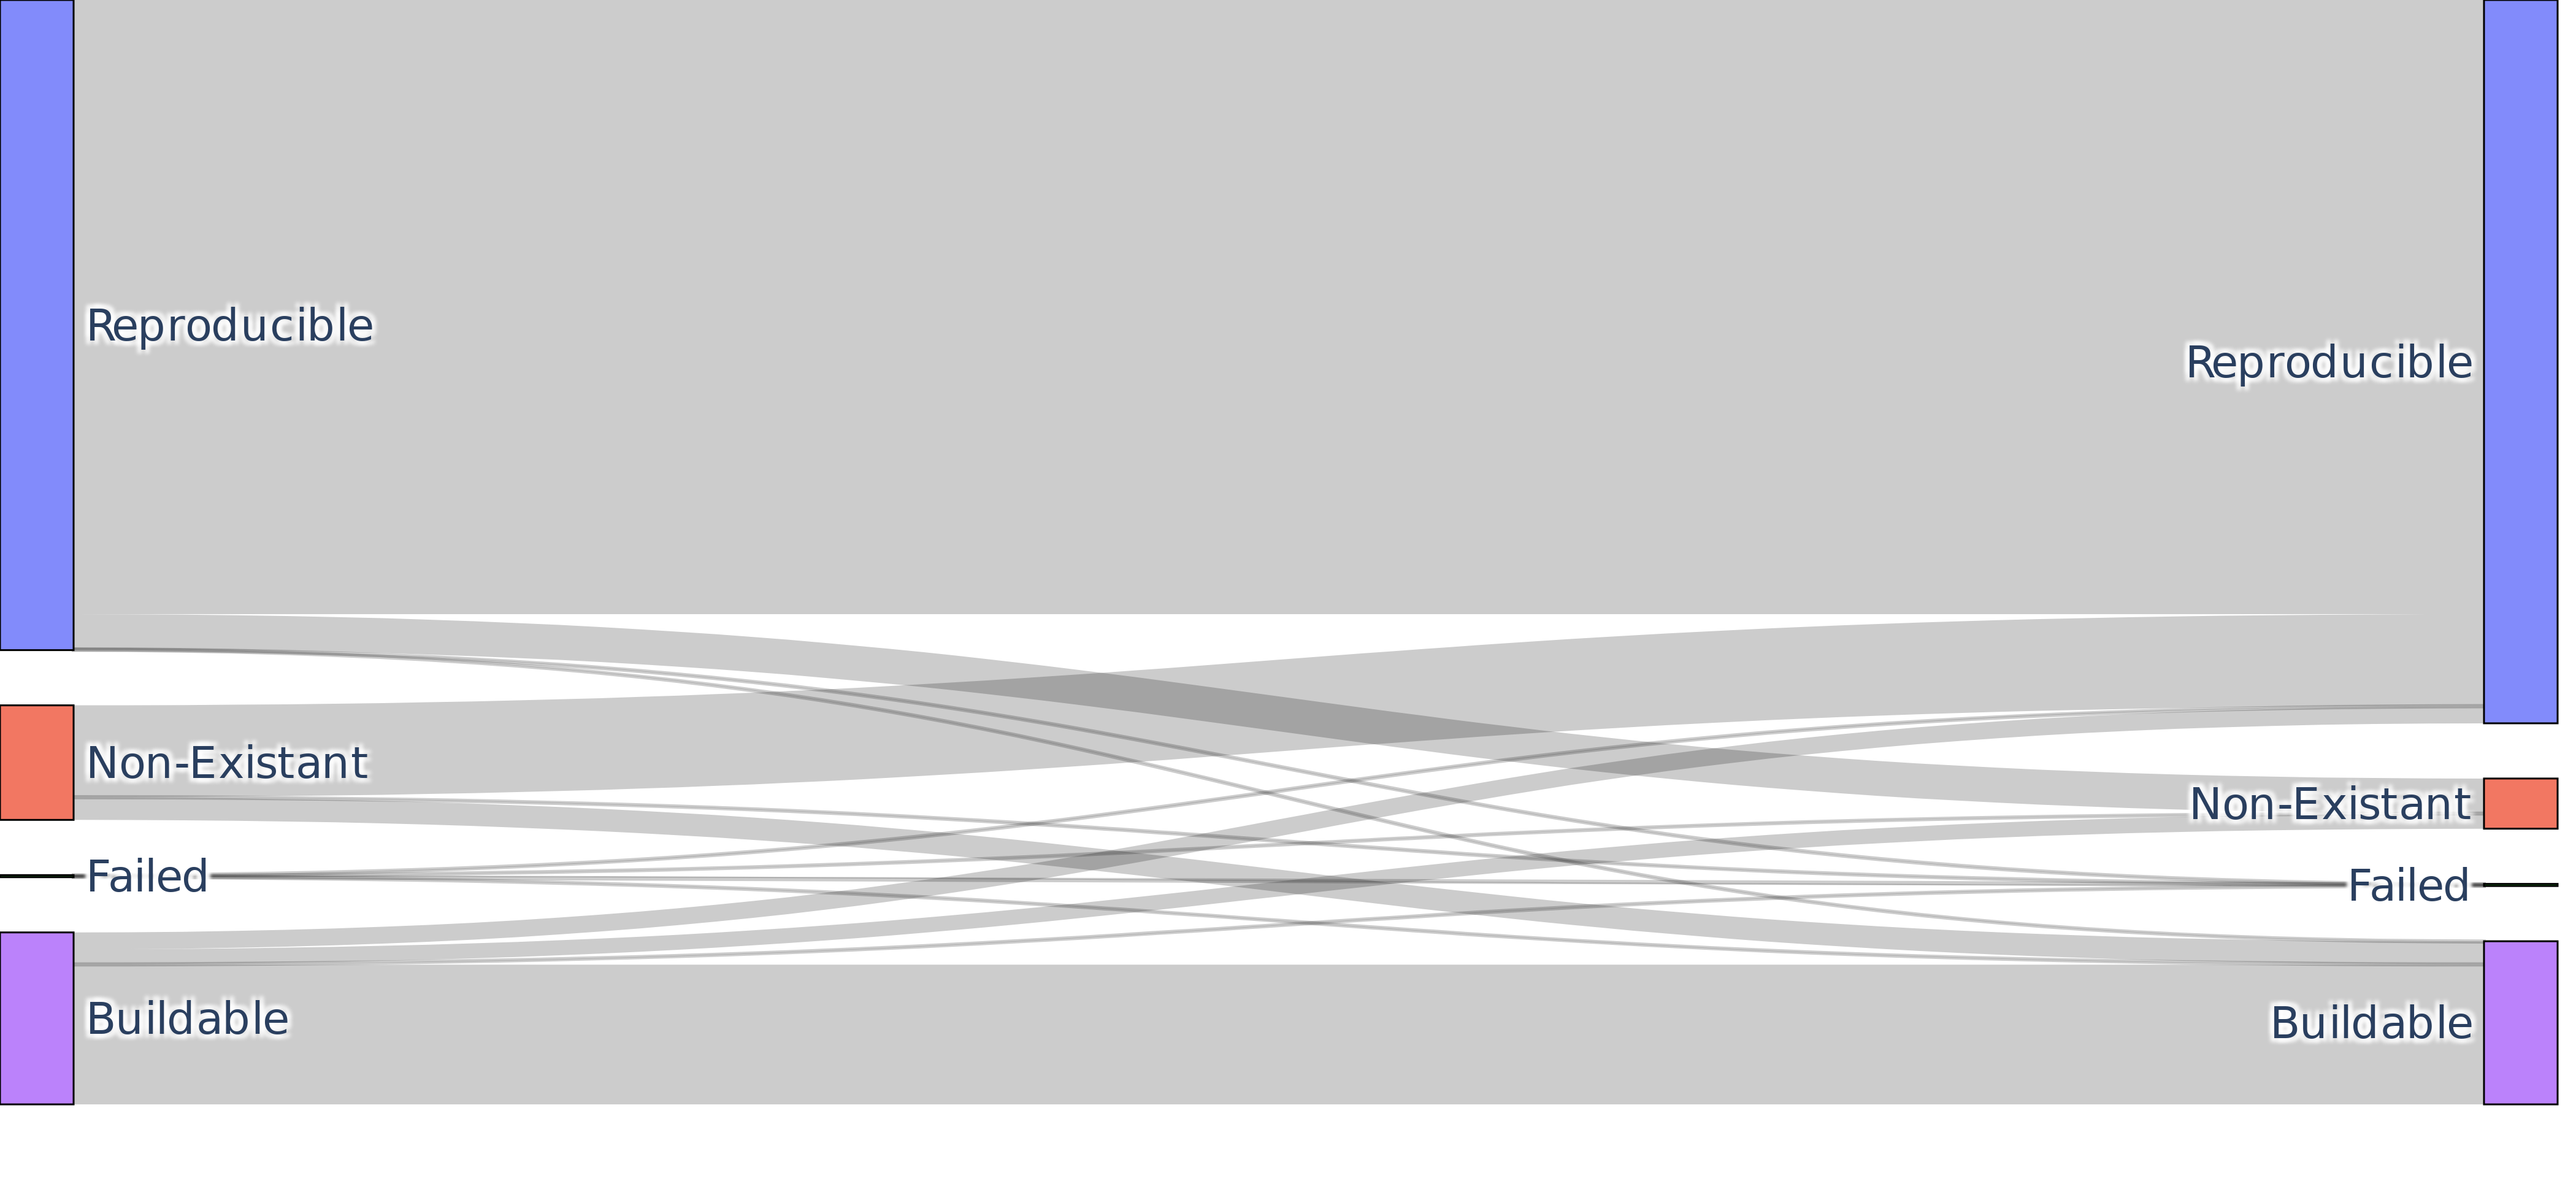
The image is a Sankey diagram illustrating the flow of build status. It shows the distribution of projects across different build outcomes, with the width of the connecting flows indicating the relative proportion of projects transitioning between statuses. The diagram has three categories on the left: "Reproducible" (blue), "Non-Existant" (orange), and "Buildable" (purple), and the same three categories on the right. The flows between the categories show how projects transition from one status to another.
### Components/Axes
* **Left Categories:**
* Reproducible (Blue)
* Non-Existant (Orange)
* Failed (Black)
* Buildable (Purple)
* **Right Categories:**
* Reproducible (Blue)
* Non-Existant (Orange)
* Failed (Black)
* Buildable (Purple)
* **Flows:** Grey flows connect the categories on the left to the categories on the right, indicating the movement of projects between statuses. The width of the flows represents the relative proportion of projects transitioning between statuses.
### Detailed Analysis
* **Reproducible (Blue):** A very large flow connects "Reproducible" on the left to "Reproducible" on the right, indicating that a significant proportion of projects remain reproducible.
* **Non-Existant (Orange):** Flows connect "Non-Existant" on the left to all three categories on the right.
* **Failed (Black):** Flows connect "Failed" on the left to all three categories on the right.
* **Buildable (Purple):** Flows connect "Buildable" on the left to all three categories on the right.
### Key Observations
* The largest flow is between "Reproducible" on the left and "Reproducible" on the right, suggesting that most projects that are initially reproducible remain so.
* The flows from "Non-Existant", "Failed", and "Buildable" on the left are distributed across all three categories on the right, indicating that projects in these states can transition to any of the three states.
### Interpretation
The Sankey diagram provides a visual representation of how build statuses change over time or across different stages of a project. The large flow between "Reproducible" categories suggests that maintaining reproducibility is a stable state for many projects. The distribution of flows from the other categories indicates that projects that are initially non-existent, failed, or buildable can transition to any of the three states, highlighting the dynamic nature of build statuses. The diagram could be used to identify areas where projects are frequently transitioning between statuses, which could indicate potential issues or areas for improvement in the build process.