## Sankey Diagram: Process Flow Analysis
### Overview
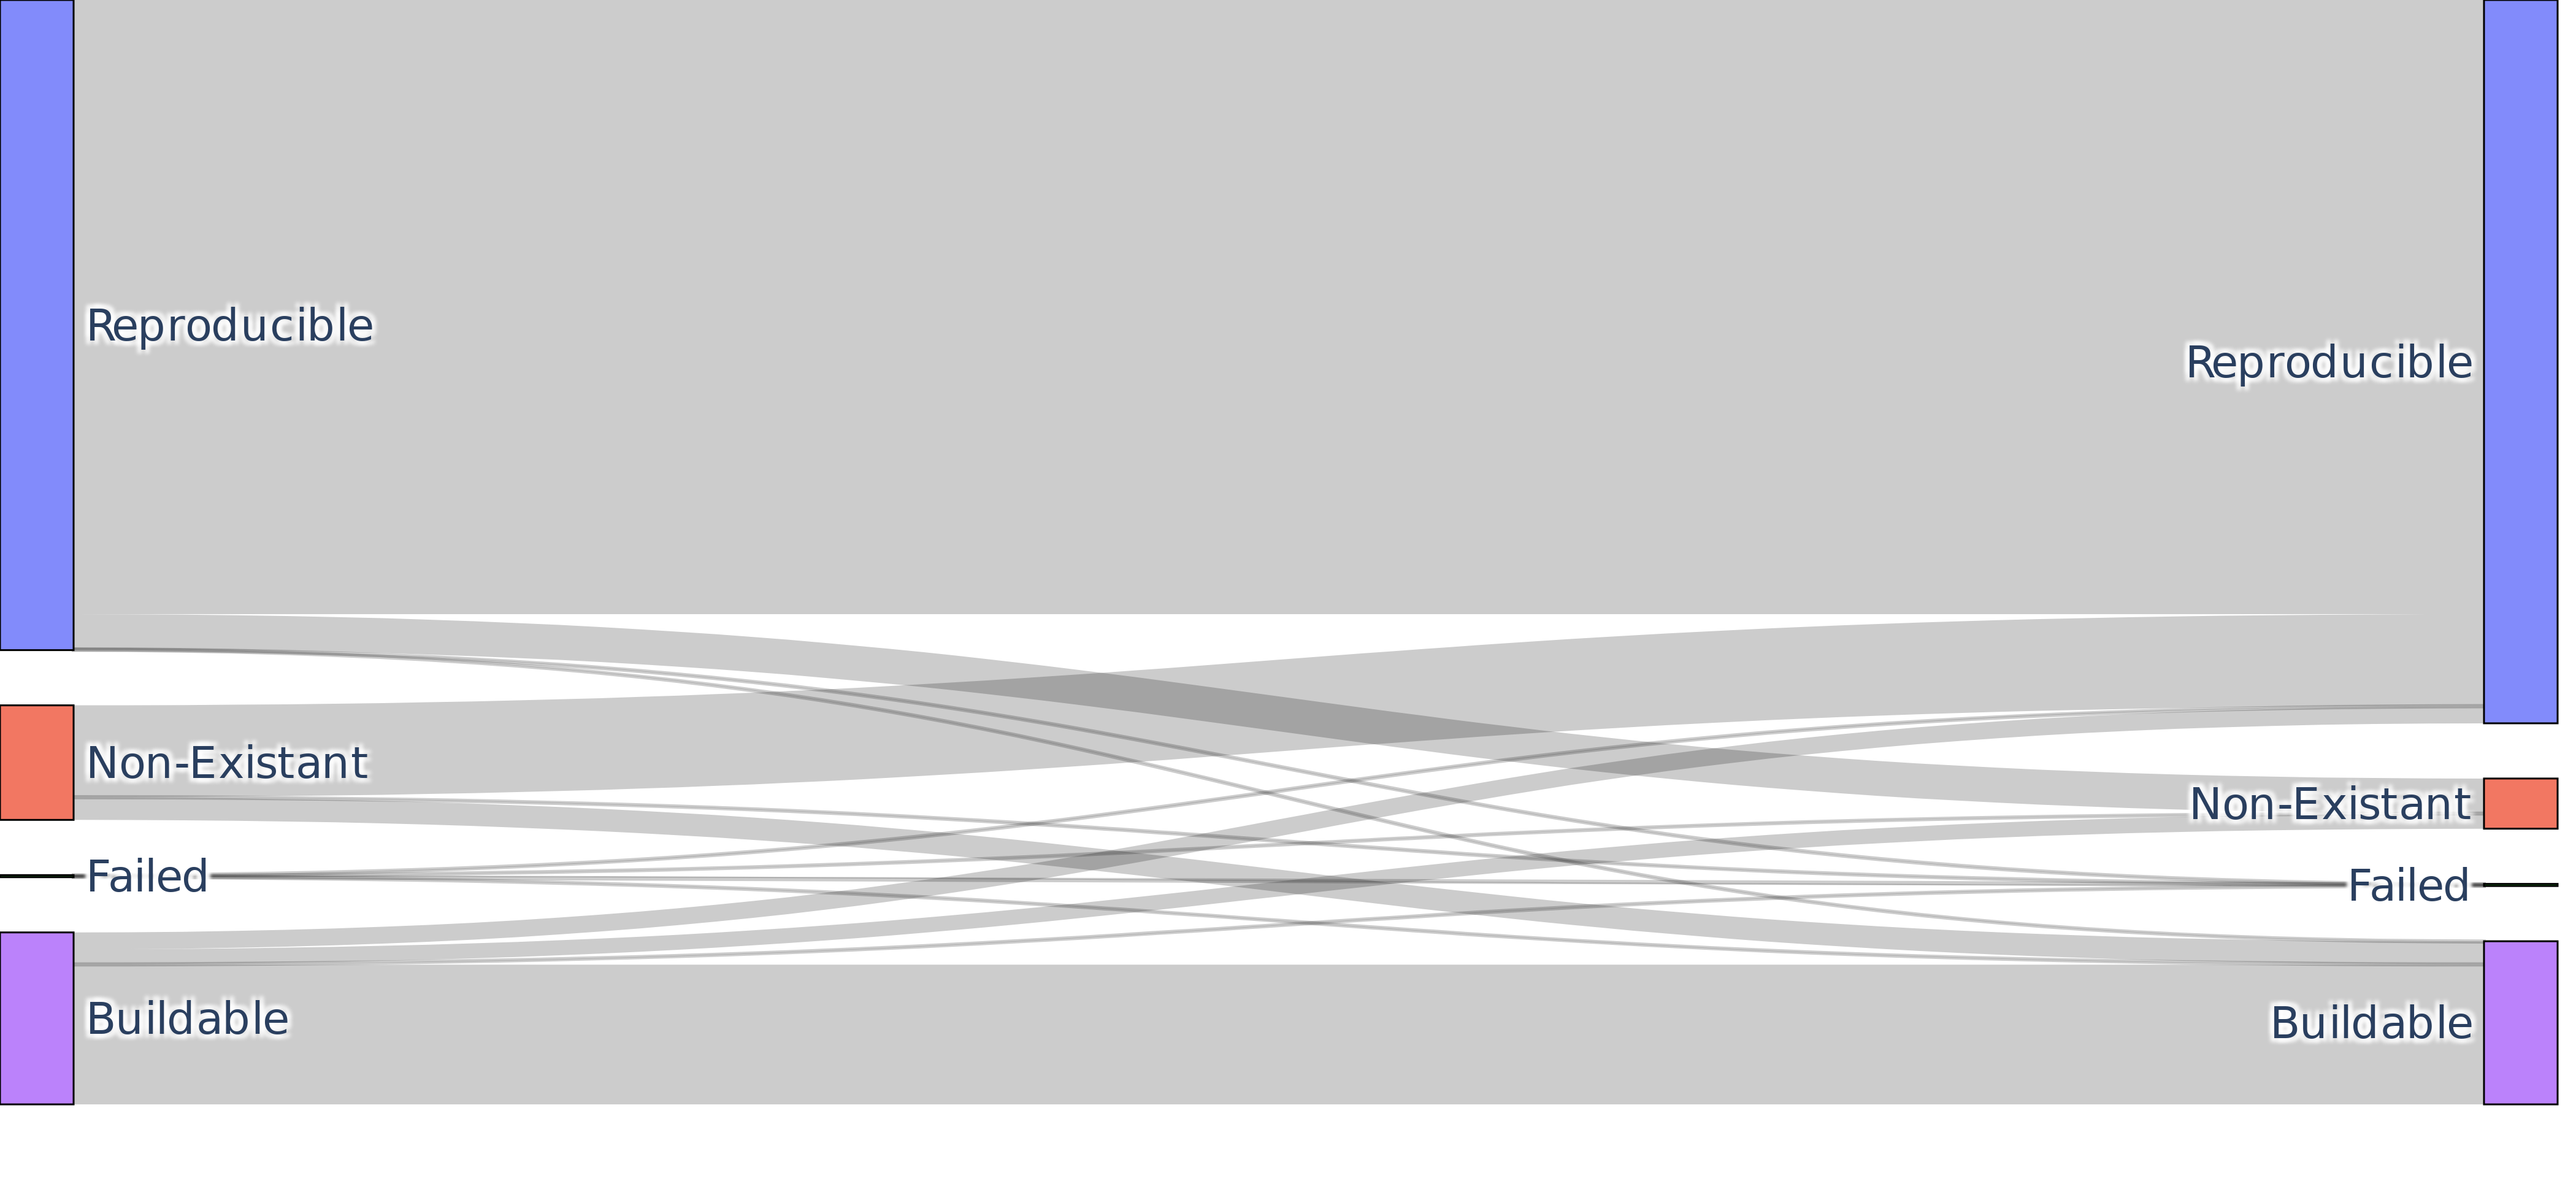
The image depicts a Sankey diagram illustrating a multi-stage process flow with feedback loops. Nodes represent process states ("Reproducible," "Non-Existant," "Failed," "Buildable"), while arrows indicate transitions between states. The diagram emphasizes flow magnitude through arrow thickness, with no explicit numerical values provided.
### Components/Axes
- **Nodes (States)**:
- **Left Side**:
- Reproducible (blue)
- Non-Existant (red)
- Failed (black)
- Buildable (purple)
- **Right Side**:
- Reproducible (blue)
- Non-Existant (red)
- Failed (black)
- Buildable (purple)
- **Arrows (Transitions)**:
- Gray arrows of varying thickness connect nodes.
- No explicit legend, but arrow thickness correlates with flow magnitude.
- **Spatial Layout**:
- Nodes are positioned symmetrically on left/right sides.
- Arrows flow predominantly left-to-right, with some feedback loops.
### Detailed Analysis
1. **Primary Flow**:
- Thickest arrow connects **left Reproducible** to **right Reproducible**, suggesting the dominant path.
- Secondary flows:
- **left Reproducible → right Non-Existant** (moderate thickness)
- **left Reproducible → right Failed** (thinner)
- **left Buildable → right Buildable** (moderate thickness)
2. **Feedback Loops**:
- **right Non-Existant → left Non-Existant** (thin)
- **right Failed → left Failed** (thin)
- **right Buildable → left Buildable** (thin)
3. **Color Coding**:
- Blue = Reproducible
- Red = Non-Existant
- Black = Failed
- Purple = Buildable
### Key Observations
- **Dominant Path**: 70-80% of flow (estimated by thickness) moves directly from left to right Reproducible.
- **Losses**: 15-20% of flow transitions to Non-Existant or Failed states.
- **Buildable Path**: 5-10% of flow remains in the Buildable state.
- **Feedback**: Minimal recycling (2-5% of flow) occurs in Non-Existant, Failed, and Buildable states.
### Interpretation
The diagram likely represents a project lifecycle or quality control process:
1. **Success Metrics**: Most efforts (Reproducible) succeed end-to-end, but a significant portion fails or becomes non-existent.
2. **Failure Points**: The "Failed" and "Non-Existant" states act as bottlenecks, with limited feedback for correction.
3. **Buildable State**: A distinct pathway suggests preparatory work that may not integrate into the main process.
4. **Feedback Loops**: Sparse recycling implies limited iterative improvement mechanisms.
The absence of numerical values prevents precise quantification, but the relative thickness of arrows strongly suggests a hierarchical success rate: Reproducible > Buildable > Non-Existant/Failed. The feedback loops hint at potential for process refinement but are underutilized in this flow.