# Technical Document Analysis of Chart
## Title
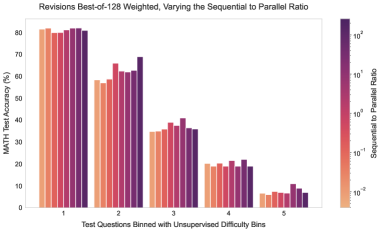
**Revisions Best-of-128 Weighted, Varying the Sequential to Parallel Ratio**
---
## Axes and Labels
- **X-Axis**:
- Label: *"Test Questions Binned with Unsupervised Difficulty Bins"*
- Categories: `1`, `2`, `3`, `4`, `5` (representing difficulty bins).
- **Y-Axis**:
- Label: *"MATH Test Accuracy (%)"*
- Scale: `0` to `80` (increments of `10`).
---
## Legend and Color Scale
- **Legend**:
- Label: *"Sequential to Parallel Ratio"*
- Color Scale:
- **Orange** (`#FFA07A`): `10^-2`
- **Red** (`#FF4500`): `10^-1`
- **Purple** (`#8A2BE2`): `10^2`
- Placement: Right side of the chart (vertical orientation).
---
## Chart Structure
- **Bars**:
- Each x-axis category (`1`–`5`) has 5 bars, corresponding to the 5 sequential-to-parallel ratios.
- Bar colors match the legend’s color scale.
---
## Key Trends and Data Points
1. **Bin 1 (Easiest Difficulty)**:
- **Trend**: Accuracy decreases as the sequential-to-parallel ratio increases (orange → purple).
- **Data Points**:
- `10^-2` (orange): ~80%
- `10^-1` (red): ~78%
- `10^0` (pink): ~82%
- `10^1` (magenta): ~81%
- `10^2` (purple): ~80%
2. **Bin 2 (Moderate Difficulty)**:
- **Trend**: Accuracy peaks at `10^1` (magenta) and declines slightly for higher ratios.
- **Data Points**:
- `10^-2`: ~58%
- `10^-1`: ~62%
- `10^0`: ~60%
- `10^1`: ~68%
- `10^2`: ~65%
3. **Bin 3 (Harder Difficulty)**:
- **Trend**: Accuracy increases with ratio up to `10^1`, then plateaus.
- **Data Points**:
- `10^-2`: ~35%
- `10^-1`: ~37%
- `10^0`: ~39%
- `10^1`: ~41%
- `10^2`: ~36%
4. **Bin 4 (Very Hard Difficulty)**:
- **Trend**: Accuracy peaks at `10^0` and declines for higher ratios.
- **Data Points**:
- `10^-2`: ~20%
- `10^-1`: ~22%
- `10^0`: ~24%
- `10^1`: ~21%
- `10^2`: ~18%
5. **Bin 5 (Hardest Difficulty)**:
- **Trend**: Accuracy is lowest across all ratios, with minimal variation.
- **Data Points**:
- `10^-2`: ~6%
- `10^-1`: ~7%
- `10^0`: ~8%
- `10^1`: ~10%
- `10^2`: ~5%
---
## Spatial Grounding
- **Legend Position**: Right side of the chart (vertical color bar).
- **Color Consistency**:
- Confirmed: Bar colors match legend colors (e.g., darkest purple corresponds to `10^2`).
---
## Component Isolation
1. **Header**:
- Title: *"Revisions Best-of-128 Weighted, Varying the Sequential to Parallel Ratio"*.
2. **Main Chart**:
- Bar chart with grouped bars per difficulty bin.
3. **Footer**:
- No explicit footer; legend acts as a secondary reference.
---
## Language and Text Extraction
- **Primary Language**: English.
- **Transcribed Text**:
- Axis labels, legend label, and title are in English.
- No non-English text detected.
---
## Summary
The chart compares MATH test accuracy across 5 difficulty bins, varying the sequential-to-parallel ratio. Higher ratios (darker purple) generally improve accuracy in easier bins (`1`–`2`), but performance plateaus or declines in harder bins (`3`–`5`). The strongest effect is observed in Bin 2, where `10^1` ratio achieves peak accuracy (~68%).