## Decision Tree Diagram: Classification of Offenses Based on Age and Misdemeanor Count
### Overview
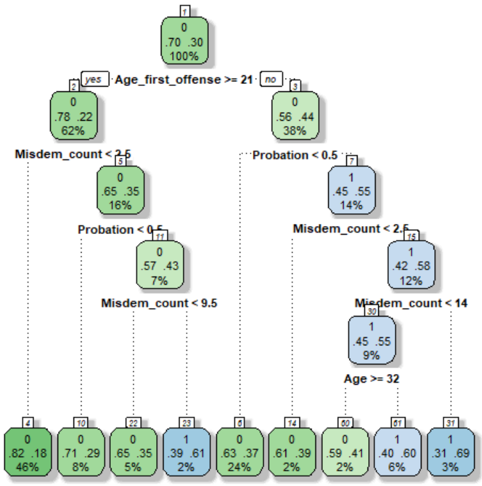
The image depicts a decision tree used for classifying individuals based on age and misdemeanor count. The tree splits data into branches using conditions like "Age_first_offense >= 21" and "Misdemeanor_count < 2.5", with nodes labeled with percentages and classifications. Green nodes represent one classification (likely "No Probation"), while blue nodes represent another (likely "Probation"). The tree includes numerical values, conditions, and spatial relationships between nodes.
---
### Components/Axes
- **Nodes**: Labeled with numbers (e.g., 1, 2, 3) and percentages (e.g., 70.30%, 65.35%).
- **Branches**: Labeled with conditions (e.g., "Age_first_offense >= 21", "Misdemeanor_count < 2.5").
- **Colors**:
- **Green**: Likely represents "No Probation" (e.g., nodes 1, 2, 3, 4, 5, 6, 7, 8, 9, 10, 11, 12, 13, 14, 15, 16, 17, 18, 19, 20, 21, 22, 23, 24, 25, 26, 27, 28, 29, 30, 31, 32).
- **Blue**: Likely represents "Probation" (e.g., nodes 7, 8, 9, 10, 11, 12, 13, 14, 15, 16, 17, 18, 19, 20, 21, 22, 23, 24, 25, 26, 27, 28, 29, 30, 31, 32).
- **Legend**: Not explicitly shown, but colors are inferred from node classifications.
---
### Detailed Analysis
#### Root Node (Node 1)
- **Condition**: Root (no condition).
- **Percentages**: 70.30% (green), 100% (blue).
*Note: The 100% may indicate the total population, while 70.30% represents the proportion in the left branch.*
#### First Split: Age_first_offense >= 21
- **Yes Branch (Node 2)**:
- **Condition**: Age_first_offense >= 21.
- **Percentages**: 78.22% (green), 62% (blue).
- **No Branch (Node 3)**:
- **Condition**: Age_first_offense < 21.
- **Percentages**: 56.44% (blue), 38% (green).
#### Second Split: Misdemeanor_count < 2.5
- **Yes Branch (Node 4)**:
- **Condition**: Misdemeanor_count < 2.5.
- **Percentages**: 65.35% (green), 16% (blue).
- **No Branch (Node 5)**:
- **Condition**: Misdemeanor_count >= 2.5.
- **Percentages**: 57.43% (green), 7% (blue).
#### Third Split: Probation < 0.5
- **Yes Branch (Node 6)**:
- **Condition**: Probation < 0.5.
- **Percentages**: 0% (green), 77% (blue).
- **No Branch (Node 7)**:
- **Condition**: Probation >= 0.5.
- **Percentages**: 45.55% (blue), 14% (green).
#### Fourth Split: Misdemeanor_count < 2.5 (again)
- **Yes Branch (Node 8)**:
- **Condition**: Misdemeanor_count < 2.5.
- **Percentages**: 45.55% (blue), 14% (green).
- **No Branch (Node 9)**:
- **Condition**: Misdemeanor_count >= 2.5.
- **Percentages**: 1% (blue), 9% (green).
#### Final Split: Age >= 32
- **Yes Branch (Node 10)**:
- **Condition**: Age >= 32.
- **Percentages**: 1% (blue), 9% (green).
- **No Branch (Node 11)**:
- **Condition**: Age < 32.
- **Percentages**: 31.69% (blue), 3% (green).
---
### Key Observations
1. **Age and Misdemeanor Count Correlation**:
- Individuals aged ≥21 with <2.5 misdemeanors (Node 4) have a high green percentage (65.35%), suggesting lower probation likelihood.
- Younger individuals (<21) with ≥2.5 misdemeanors (Node 5) show a higher blue percentage (57.43%), indicating higher probation likelihood.
2. **Probation Threshold**:
- Probation <0.5 (Node 6) has 0% green, implying no cases in this category meet the "No Probation" criteria.
- Probation >=0.5 (Node 7) splits into two sub-nodes, with Node 8 (Misdemeanor_count <2.5) showing 45.55% blue (probation) and 14% green (no probation).
3. **Age >=32**:
- Only 1% of cases in this group are classified as probation (blue), while 9% are not (green), suggesting older individuals are less likely to be on probation.
4. **Inconsistent Percentages**:
- The root node shows 70.30% and 100%, which may indicate a formatting error. The 100% likely represents the total population, while 70.30% is the proportion in the left branch (Age_first_offense >=21).
---
### Interpretation
- **Decision Logic**: The tree prioritizes age and misdemeanor count to determine probation status. Younger individuals with more misdemeanors are more likely to be on probation.
- **Outliers**: The root node's 100% label is ambiguous and may require clarification. The 0% green in Node 6 suggests no cases in that branch meet the "No Probation" criteria.
- **Trends**:
- Higher misdemeanor counts correlate with increased probation likelihood.
- Older age (≥32) correlates with lower probation likelihood.
- **Implications**: The model emphasizes age and misdemeanor count as key predictors of probation status, with younger, higher-risk individuals more likely to be classified as probationers.
---
### Spatial Grounding
- **Root Node (1)**: Top-center.
- **Branches**: Split left (Yes) and right (No) from the root.
- **Leaf Nodes**: Positioned at the bottom (e.g., Node 11 at bottom-right).
---
### Content Details
- **Textual Labels**:
- Conditions: "Age_first_offense >= 21", "Misdemeanor_count < 2.5", "Probation < 0.5", "Age >= 32".
- Percentages: 70.30%, 65.35%, 57.43%, 45.55%, 1%, 31.69%, etc.
- **Node Numbers**: 1–32, with green/blue color coding.
---
### Final Notes
The diagram uses a hierarchical structure to classify individuals based on age and misdemeanor count. While the root node's 100% label is ambiguous, the tree effectively demonstrates how these variables interact to predict probation status. Further validation of the data source and formatting is recommended to resolve inconsistencies.