## Decision Tree: Classification Model
### Overview
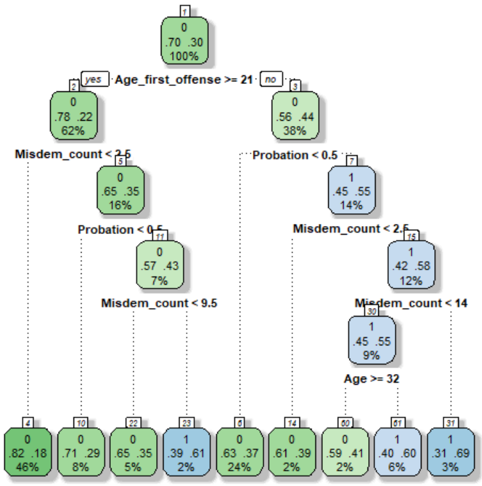
The image depicts a decision tree, a classification model used to predict a binary outcome (0 or 1). The tree branches based on different features (Age_first_offense, Misdem_count, Probation), leading to leaf nodes that represent the predicted class and its associated probability.
### Components/Axes
* **Nodes:** Each node represents a decision point or a final prediction.
* The number at the top-right of each node is the node ID.
* The two numbers in the center of each node represent the probability of belonging to class 0 and class 1, respectively.
* The percentage at the bottom of each node represents the percentage of samples that fall into that node.
* **Root Node:** Node 0 at the top, representing the starting point of the decision tree.
* **Decision Rules:** Each branch represents a decision rule based on a feature.
* **Leaf Nodes:** The nodes at the bottom of the tree, representing the final predictions.
* **Colors:**
* Green nodes: Predominantly class 0.
* Blue nodes: Predominantly class 1.
### Detailed Analysis or ### Content Details
**Root Node (Node 0):**
* Probability: 0.70 (class 0), 0.30 (class 1)
* Percentage: 100%
**First Split: Age_first_offense >= 21**
* **Left Branch (Yes - Node 2):**
* Probability: 0.78 (class 0), 0.22 (class 1)
* Percentage: 62%
* **Right Branch (No - Node 3):**
* Probability: 0.56 (class 0), 0.44 (class 1)
* Percentage: 38%
**Second Level Splits:**
* **Node 2 (Misdem_count < 2.5 - Node 5):**
* Probability: 0.65 (class 0), 0.35 (class 1)
* Percentage: 16%
* **Node 3 (Probation < 0.5 - Node 7):**
* Probability: 0.45 (class 0), 0.55 (class 1)
* Percentage: 14%
**Third Level Splits:**
* **Node 5 (Probation < 0.5 - Node 11):**
* Probability: 0.57 (class 0), 0.43 (class 1)
* Percentage: 7%
* **Node 7 (Misdem_count < 2.5 - Node 15):**
* Probability: 0.42 (class 0), 0.58 (class 1)
* Percentage: 12%
**Fourth Level Splits:**
* **Node 15 (Misdem_count < 14 - Node 30):**
* Probability: 0.45 (class 0), 0.55 (class 1)
* Percentage: 9%
* **Node 30 (Age >= 32):**
* No further split.
**Leaf Nodes (Bottom Row):**
* Node 4: 0.82 (class 0), 0.18 (class 1), 46%
* Node 10: 0.71 (class 0), 0.29 (class 1), 8%
* Node 22: 0.65 (class 0), 0.35 (class 1), 5%
* Node 23: 0.39 (class 0), 0.61 (class 1), 2%
* Node 6: 0.63 (class 0), 0.37 (class 1), 24%
* Node 14: 0.61 (class 0), 0.39 (class 1), 2%
* Node 60: 0.59 (class 0), 0.41 (class 1), 2%
* Node 61: 0.40 (class 0), 0.60 (class 1), 6%
* Node 31: 0.31 (class 0), 0.69 (class 1), 3%
### Key Observations
* The tree uses features like "Age_first_offense", "Misdem_count", and "Probation" to classify the outcome.
* The root node has a higher probability of class 0 (0.70) compared to class 1 (0.30).
* The leaf nodes show varying probabilities for each class, indicating the model's prediction for different segments of the data.
* The percentage of samples decreases as the tree branches, indicating the distribution of data across different decision paths.
* Nodes 23, 61, and 31 are predominantly class 1.
### Interpretation
The decision tree model attempts to classify an outcome based on a series of sequential decisions. The features used in the tree ("Age_first_offense", "Misdem_count", "Probation") are likely factors that influence the outcome being predicted.
The tree structure reveals how different combinations of these features lead to different predictions. For example, if "Age_first_offense" is less than 21 and "Probation" is less than 0.5, the model follows the right branch from the root node, potentially leading to a different prediction than if "Age_first_offense" is greater than or equal to 21.
The probabilities in the leaf nodes represent the model's confidence in its prediction for a given segment of the data. For instance, Node 4 has a high probability of class 0 (0.82), suggesting that samples falling into this node are more likely to belong to class 0.
The percentages at each node indicate the proportion of the original dataset that flows through that node. This can be useful for understanding the relative importance of different decision paths in the tree.