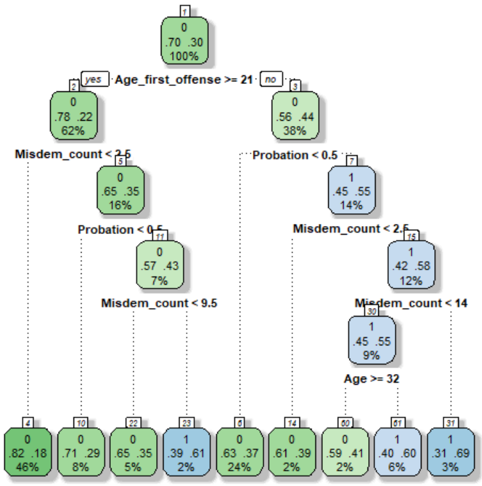
## Diagram: Decision Tree
### Overview
The image depicts a decision tree, likely used for classification or prediction. The tree branches based on conditions related to "Age_first_offense", "Misdem_count", and "Probation", ultimately leading to terminal nodes representing outcomes with associated probabilities. The tree is structured hierarchically, starting from a root node (node 0) and branching down to leaf nodes.
### Components/Axes
The diagram consists of rectangular nodes connected by branches. Each node contains:
* A node number (e.g., 0, 1, 2)
* A condition or outcome (e.g., "Age_first_offense >= 21", "0", "1")
* Three numerical values, likely representing counts or probabilities. The first two are decimal values, and the third is a percentage.
The branches are labeled with the conditions that lead to the split. The tree is oriented from top to bottom.
### Detailed Analysis or Content Details
**Node 0:**
* Condition: None (Root Node)
* Values: .70 .30 100%
**Node 1 (Branching from Node 0 - "yes" for Age_first_offense >= 21):**
* Condition: None
* Values: .78 .22 62%
**Node 2 (Branching from Node 1 - "Misdem_count < 2.5"):**
* Condition: None
* Values: .65 .35 16%
**Node 3 (Branching from Node 1 - "Probation < 0.5"):**
* Condition: None
* Values: .57 .43 7%
**Node 4 (Branching from Node 3 - "Misdem_count < 9.5"):**
* Condition: None
* Values: None
**Node 5 (Branching from Node 0 - "no" for Age_first_offense >= 21):**
* Condition: None
* Values: .56 .44 38%
**Node 6 (Branching from Node 5 - "Probation < 0.5"):**
* Condition: None
* Values: .45 .55 14%
**Node 7 (Branching from Node 5 - "Misdem_count < 2.5"):**
* Condition: None
* Values: .42 .58 12%
**Node 8 (Branching from Node 7 - "Misdem_count < 14"):**
* Condition: None
* Values: .45 .55 9%
**Node 9 (Branching from Node 8 - "Age >= 32"):**
* Condition: None
* Values: None
**Leaf Nodes (Terminal Nodes):**
* Node 10: 0 .82 .18 46%
* Node 11: 0 .71 .29 8%
* Node 12: 0 .65 .35 5%
* Node 13: 1 .39 .61 2%
* Node 14: 0 .63 .37 24%
* Node 15: 0 .61 .39 2%
* Node 16: 0 .59 .41 2%
* Node 17: 1 .40 .60 6%
* Node 18: 1 .31 .69 3%
### Key Observations
* The tree splits primarily on "Age_first_offense", "Misdem_count", and "Probation".
* The percentage values at the terminal nodes likely represent the proportion of instances falling into that category.
* The values .70 and .30 at the root node suggest a baseline distribution.
* The leaf nodes have varying percentages, indicating different levels of confidence or prevalence.
* The values "0" and "1" appear in the leaf nodes, suggesting a binary outcome.
### Interpretation
This decision tree appears to be a model for predicting a binary outcome (represented by "0" and "1") based on the characteristics of an individual's first offense. The tree attempts to classify individuals based on their age at the first offense, the number of misdemeanors, and their probation status.
The root node suggests that, overall, there's a 70% chance of outcome "0" and a 30% chance of outcome "1". The subsequent splits refine these probabilities based on the specified conditions. For example, if the age at the first offense is greater than or equal to 21, the probability of outcome "0" increases to 78%, while the probability of outcome "1" decreases to 22%.
The leaf nodes provide the final predicted probabilities for each combination of conditions. The varying percentages at the leaf nodes indicate that the model is more confident in some predictions than others. The model is likely used to assess risk or make decisions related to sentencing or rehabilitation. The presence of "0" and "1" in the leaf nodes suggests a binary classification problem, such as predicting whether an individual will re-offend or not.