TECHNICAL ASSET FINGERPRINT
6cb251307a0542cca7921566
Click to view fullscreen
Press ESC or click to close
FOUND IN PAPERS
EXPERT: healer-alpha-free VERSION 1
RUNTIME: free/openrouter/healer-alpha
INTEL_VERIFIED
\n
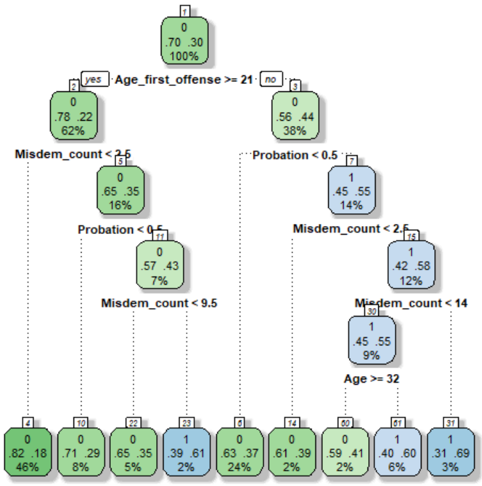
## Decision Tree Diagram: Offender Risk Classification
### Overview
This image displays a binary classification decision tree model, likely used for predicting an outcome (labeled as class `0` or `1`) based on offender characteristics. The tree structure shows a series of hierarchical, binary splits based on feature thresholds, leading to final prediction nodes (leaves). The color coding (green for class `0`, blue for class `1`) visually indicates the predicted class at each node.
### Components/Axes
* **Tree Structure:** A hierarchical diagram with a root node at the top, internal decision nodes, and terminal leaf nodes at the bottom.
* **Node Information:** Each node (box) contains:
* A node identifier number (top center, e.g., `1`, `2`).
* The predicted class (`0` or `1`).
* Two probability values (e.g., `.70 .30`), representing the model's confidence for classes `0` and `1` respectively.
* A percentage value (e.g., `100%`), representing the proportion of the total dataset reaching that node.
* **Split Conditions:** Text labels on the connecting lines between nodes define the decision rule (e.g., `Age_first_offense >= 21`).
* **Color Legend (Implied):**
* **Green Nodes:** Predicted class `0`.
* **Blue Nodes:** Predicted class `1`.
* **Spatial Layout:** The tree flows from top to bottom. The root is centered at the top. Each split creates left (`yes`) and right (`no`) branches. The final leaf nodes are arranged in a horizontal row at the bottom.
### Detailed Analysis
**Root Node (Node 1):**
* **Position:** Top-center.
* **Data:** Predicts class `0`. Probabilities: 70% for `0`, 30% for `1`. Contains 100% of the sample.
* **First Split:** `Age_first_offense >= 21`.
* **Yes (Left Branch):** Leads to Node 2.
* **No (Right Branch):** Leads to Node 3.
**Left Subtree (Branch for `Age_first_offense >= 21`):**
* **Node 2:** Predicts class `0`. Probabilities: 78% for `0`, 22% for `1`. Contains 62% of the sample.
* **Split:** `Misdem_count < 2.5`.
* **Yes (Left):** Leads to Node 4.
* **No (Right):** Leads to Node 5.
* **Node 4:** Predicts class `0`. Probabilities: 65% for `0`, 35% for `1`. Contains 16% of the sample.
* **Split:** `Probation < 0.5`.
* **Yes (Left):** Leads to Leaf Node 9.
* **No (Right):** Leads to Leaf Node 10.
* **Node 5:** Predicts class `0`. Probabilities: 57% for `0`, 43% for `1`. Contains 7% of the sample.
* **Split:** `Misdem_count < 9.5`.
* **Yes (Left):** Leads to Leaf Node 11.
* **No (Right):** Leads to Leaf Node 12.
**Right Subtree (Branch for `Age_first_offense < 21`):**
* **Node 3:** Predicts class `0`. Probabilities: 56% for `0`, 44% for `1`. Contains 38% of the sample.
* **Split:** `Probation < 0.5`.
* **Yes (Left):** Leads to Node 6.
* **No (Right):** Leads to Node 7.
* **Node 6:** Predicts class `1`. Probabilities: 45% for `0`, 55% for `1`. Contains 14% of the sample.
* **Split:** `Misdem_count < 2.5`.
* **Yes (Left):** Leads to Leaf Node 13.
* **No (Right):** Leads to Leaf Node 14.
* **Node 7:** Predicts class `1`. Probabilities: 42% for `0`, 58% for `1`. Contains 12% of the sample.
* **Split:** `Misdem_count < 14`.
* **Yes (Left):** Leads to Node 8.
* **No (Right):** Leads to Leaf Node 15.
* **Node 8:** Predicts class `1`. Probabilities: 45% for `0`, 55% for `1`. Contains 9% of the sample.
* **Split:** `Age >= 32`.
* **Yes (Left):** Leads to Leaf Node 16.
* **No (Right):** Leads to Leaf Node 17.
**Leaf Nodes (Bottom Row, Left to Right):**
* **Node 9:** Green. Predicts `0`. Probabilities: .82 .18. Sample: 46%.
* **Node 10:** Green. Predicts `0`. Probabilities: .71 .29. Sample: 8%.
* **Node 11:** Green. Predicts `0`. Probabilities: .65 .35. Sample: 5%.
* **Node 12:** Blue. Predicts `1`. Probabilities: .39 .61. Sample: 2%.
* **Node 13:** Green. Predicts `0`. Probabilities: .63 .37. Sample: 24%.
* **Node 14:** Green. Predicts `0`. Probabilities: .61 .39. Sample: 2%.
* **Node 15:** Green. Predicts `0`. Probabilities: .59 .41. Sample: 2%.
* **Node 16:** Blue. Predicts `1`. Probabilities: .40 .60. Sample: 6%.
* **Node 17:** Blue. Predicts `1`. Probabilities: .31 .69. Sample: 3%.
### Key Observations
1. **Feature Hierarchy:** The most important feature for the initial split is `Age_first_offense` (threshold 21). The next most frequent features are `Misdem_count` (used 4 times) and `Probation` (used 2 times). `Age` is used once, deep in the tree.
2. **Class Distribution:** The root class distribution is 70/30 in favor of class `0`. The largest leaf node (Node 9, 46% of sample) strongly predicts class `0` (82% probability). The strongest prediction for class `1` is in Leaf Node 17 (69% probability).
3. **Tree Depth and Complexity:** The tree has a maximum depth of 5 splits (from root to Leaf Nodes 16/17). It is moderately complex, creating 9 distinct terminal rules.
4. **Color-Coded Flow:** The left side of the tree (older first offense) is predominantly green (class `0`). The right side (younger first offense) contains all the blue nodes (class `1`), indicating this subgroup is more likely to be classified as `1`.
### Interpretation
This decision tree models a risk or outcome classification for individuals, likely in a criminal justice context (suggested by features like "Misdem_count" and "Probation"). The model suggests that **older age at first offense (`>= 21`) is the primary indicator for a lower-risk classification (class `0`)**. Within that group, having fewer misdemeanors (`< 2.5`) and no probation (`< 0.5`) leads to the highest confidence in the low-risk prediction.
Conversely, **a younger age at first offense (`< 21`) is the gateway to a higher-risk classification (class `1`)**. For this younger group, the presence of probation (`>= 0.5`) is a key early indicator. The model further refines risk within the younger group based on the number of misdemeanors and, at a deeper level, current age.
The tree reveals interaction effects: for example, a young offender (`Age_first_offense < 21`) with no probation and few misdemeanors (`< 2.5`) is still classified as low-risk (Node 13, 63% for `0`). However, if that same young offender has a high misdemeanor count (`>= 14`), they are classified as high-risk (Node 15, 59% for `0` but note this is a weak prediction from a small sample). The deepest split (`Age >= 32`) suggests that for young offenders with a moderate misdemeanor history, being older (>=32) pushes the prediction slightly more towards class `1`.
**Limitations:** The probabilities in many nodes (especially Node 15: 59/41) indicate uncertainty. The small sample percentages in some leaves (e.g., 2%, 3%) suggest those rules may not be statistically robust. The tree provides interpretable rules but may not capture all nuances compared to more complex models.
DECODING INTELLIGENCE...