## Bar Charts: Throughput vs. Packet Delays for Different Protocols
### Overview
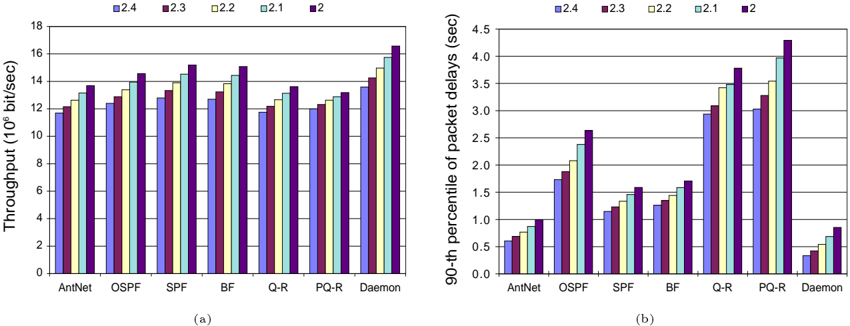
The image presents two bar charts comparing the performance of different network protocols. The left chart (a) displays the throughput in 10^6 bits/sec, while the right chart (b) shows the 90th percentile of packet delays in seconds. Both charts compare the performance of AntNet, OSPF, SPF, BF, Q-R, PQ-R, and Daemon protocols under different conditions labeled as 2.4, 2.3, 2.2, 2.1, and 2.
### Components/Axes
**Left Chart (a): Throughput**
* **Y-axis:** Throughput (10^6 bit/sec), ranging from 0 to 18 with increments of 2.
* **X-axis:** Network protocols: AntNet, OSPF, SPF, BF, Q-R, PQ-R, Daemon.
* **Legend (top):**
* Blue: 2.4
* Red: 2.3
* Yellow: 2.2
* Light Blue: 2.1
* Purple: 2
**Right Chart (b): Packet Delays**
* **Y-axis:** 90-th percentile of packet delays (sec), ranging from 0.0 to 4.5 with increments of 0.5.
* **X-axis:** Network protocols: AntNet, OSPF, SPF, BF, Q-R, PQ-R, Daemon.
* **Legend (top):**
* Blue: 2.4
* Red: 2.3
* Yellow: 2.2
* Light Blue: 2.1
* Purple: 2
### Detailed Analysis
**Left Chart (a): Throughput**
* **AntNet:** Throughput values are approximately: 2.4 (12), 2.3 (12.5), 2.2 (13), 2.1 (13.5), 2 (14).
* **OSPF:** Throughput values are approximately: 2.4 (12.5), 2.3 (13), 2.2 (13.5), 2.1 (14), 2 (14.5).
* **SPF:** Throughput values are approximately: 2.4 (13), 2.3 (13.5), 2.2 (14), 2.1 (14.5), 2 (15).
* **BF:** Throughput values are approximately: 2.4 (12.5), 2.3 (13), 2.2 (13.5), 2.1 (14), 2 (15).
* **Q-R:** Throughput values are approximately: 2.4 (12), 2.3 (12.5), 2.2 (13), 2.1 (13.5), 2 (14).
* **PQ-R:** Throughput values are approximately: 2.4 (12.5), 2.3 (13), 2.2 (13.5), 2.1 (14), 2 (14.5).
* **Daemon:** Throughput values are approximately: 2.4 (13), 2.3 (14), 2.2 (15), 2.1 (15.5), 2 (16.5).
**Trend (Throughput):** For all protocols, the throughput generally increases from 2.4 to 2.
**Right Chart (b): Packet Delays**
* **AntNet:** Packet delay values are approximately: 2.4 (0.6), 2.3 (0.7), 2.2 (0.8), 2.1 (0.9), 2 (1.0).
* **OSPF:** Packet delay values are approximately: 2.4 (1.0), 2.3 (1.8), 2.2 (2.0), 2.1 (2.3), 2 (2.7).
* **SPF:** Packet delay values are approximately: 2.4 (1.2), 2.3 (1.3), 2.2 (1.4), 2.1 (1.5), 2 (1.6).
* **BF:** Packet delay values are approximately: 2.4 (1.3), 2.3 (1.5), 2.2 (1.6), 2.1 (1.7), 2 (1.8).
* **Q-R:** Packet delay values are approximately: 2.4 (2.8), 2.3 (3.0), 2.2 (3.5), 2.1 (3.8), 2 (4.0).
* **PQ-R:** Packet delay values are approximately: 2.4 (3.0), 2.3 (3.2), 2.2 (3.6), 2.1 (4.0), 2 (4.3).
* **Daemon:** Packet delay values are approximately: 2.4 (0.3), 2.3 (0.4), 2.2 (0.5), 2.1 (0.6), 2 (0.8).
**Trend (Packet Delays):** For all protocols, the packet delays generally increase from 2.4 to 2, except for Daemon, where the delays are significantly lower.
### Key Observations
* **Throughput:** Daemon generally has the highest throughput among the protocols, especially for condition '2'. SPF also shows relatively high throughput.
* **Packet Delays:** Daemon has significantly lower packet delays compared to other protocols. PQ-R and Q-R exhibit the highest packet delays.
* **Conditions:** As the condition changes from 2.4 to 2, the throughput tends to increase, while the packet delays also increase for most protocols.
### Interpretation
The charts illustrate a trade-off between throughput and packet delays for different network protocols under varying conditions. Daemon appears to be optimized for low latency, achieving significantly lower packet delays at the expense of slightly lower throughput compared to SPF in some conditions. PQ-R and Q-R, on the other hand, exhibit high packet delays, suggesting they might prioritize other factors like reliability or quality of service. The trend of increasing throughput and packet delays from condition 2.4 to 2 suggests that the network environment or configuration changes associated with these conditions impact both the speed and latency of data transmission. The specific meaning of the conditions (2.4, 2.3, 2.2, 2.1, 2) is not provided, but they likely represent different network parameters or configurations.