## Bar Charts: Throughput and 90th Percentile Packet Delays
### Overview
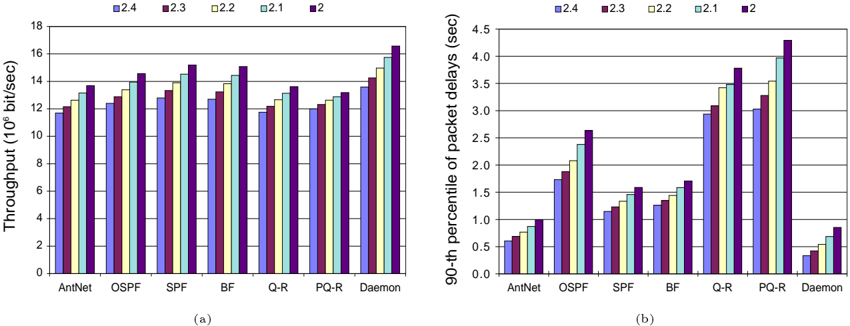
The image presents two side-by-side bar charts. Chart (a) displays throughput (in 10^6 bits/sec) for different network protocols (AntNet, OSPF, SPF, BF, Q-R, PQ-R, Daemon) under varying parameter settings (2.4, 2.3, 2.2, 2.1, and 2). Chart (b) shows the 90th percentile of packet delays (in seconds) for the same protocols and parameter settings.
### Components/Axes
**Chart (a): Throughput**
* **X-axis:** Network Protocols - AntNet, OSPF, SPF, BF, Q-R, PQ-R, Daemon
* **Y-axis:** Throughput (10^6 bit/sec) - Scale ranges from 0 to 18, with increments of 2.
* **Legend:** Located at the top-left corner.
* 2.4 (Light Blue)
* 2.3 (Green)
* 2.2 (Purple)
* 2.1 (Dark Blue)
* 2 (Gray)
**Chart (b): 90th Percentile Packet Delays**
* **X-axis:** Network Protocols - AntNet, OSPF, SPF, BF, Q-R, PQ-R, Daemon
* **Y-axis:** 90th percentile of packet delays (sec) - Scale ranges from 0 to 4.5, with increments of 0.5.
* **Legend:** Located at the top-left corner.
* 2.4 (Light Blue)
* 2.3 (Green)
* 2.2 (Purple)
* 2.1 (Dark Blue)
* 2 (Gray)
### Detailed Analysis or Content Details
**Chart (a): Throughput**
* **AntNet:** Throughput generally increases with decreasing parameter values.
* 2.4: ~11.5 x 10^6 bits/sec
* 2.3: ~12.5 x 10^6 bits/sec
* 2.2: ~13.5 x 10^6 bits/sec
* 2.1: ~14.0 x 10^6 bits/sec
* 2: ~14.5 x 10^6 bits/sec
* **OSPF:** Similar trend to AntNet, with increasing throughput as the parameter decreases.
* 2.4: ~12.0 x 10^6 bits/sec
* 2.3: ~13.0 x 10^6 bits/sec
* 2.2: ~14.0 x 10^6 bits/sec
* 2.1: ~14.5 x 10^6 bits/sec
* 2: ~15.0 x 10^6 bits/sec
* **SPF:** Shows a similar increasing trend.
* 2.4: ~12.0 x 10^6 bits/sec
* 2.3: ~13.0 x 10^6 bits/sec
* 2.2: ~14.0 x 10^6 bits/sec
* 2.1: ~14.5 x 10^6 bits/sec
* 2: ~15.5 x 10^6 bits/sec
* **BF:** Increasing trend.
* 2.4: ~12.5 x 10^6 bits/sec
* 2.3: ~13.5 x 10^6 bits/sec
* 2.2: ~14.5 x 10^6 bits/sec
* 2.1: ~15.0 x 10^6 bits/sec
* 2: ~16.0 x 10^6 bits/sec
* **Q-R:** Increasing trend.
* 2.4: ~12.0 x 10^6 bits/sec
* 2.3: ~13.0 x 10^6 bits/sec
* 2.2: ~14.0 x 10^6 bits/sec
* 2.1: ~14.5 x 10^6 bits/sec
* 2: ~15.0 x 10^6 bits/sec
* **PQ-R:** Increasing trend.
* 2.4: ~12.5 x 10^6 bits/sec
* 2.3: ~13.5 x 10^6 bits/sec
* 2.2: ~14.5 x 10^6 bits/sec
* 2.1: ~15.0 x 10^6 bits/sec
* 2: ~16.0 x 10^6 bits/sec
* **Daemon:** Shows the highest throughput values and a strong increasing trend.
* 2.4: ~14.0 x 10^6 bits/sec
* 2.3: ~15.0 x 10^6 bits/sec
* 2.2: ~16.0 x 10^6 bits/sec
* 2.1: ~16.5 x 10^6 bits/sec
* 2: ~17.0 x 10^6 bits/sec
**Chart (b): 90th Percentile Packet Delays**
* **AntNet:** Delays decrease with decreasing parameter values.
* 2.4: ~2.0 sec
* 2.3: ~1.8 sec
* 2.2: ~1.6 sec
* 2.1: ~1.4 sec
* 2: ~1.2 sec
* **OSPF:** Delays decrease with decreasing parameter values.
* 2.4: ~3.5 sec
* 2.3: ~3.0 sec
* 2.2: ~2.5 sec
* 2.1: ~2.0 sec
* 2: ~1.5 sec
* **SPF:** Delays decrease with decreasing parameter values.
* 2.4: ~3.0 sec
* 2.3: ~2.5 sec
* 2.2: ~2.0 sec
* 2.1: ~1.5 sec
* 2: ~1.0 sec
* **BF:** Delays decrease with decreasing parameter values.
* 2.4: ~1.5 sec
* 2.3: ~1.3 sec
* 2.2: ~1.1 sec
* 2.1: ~0.9 sec
* 2: ~0.7 sec
* **Q-R:** Delays decrease with decreasing parameter values.
* 2.4: ~3.5 sec
* 2.3: ~3.0 sec
* 2.2: ~2.5 sec
* 2.1: ~2.0 sec
* 2: ~1.5 sec
* **PQ-R:** Delays decrease with decreasing parameter values.
* 2.4: ~3.5 sec
* 2.3: ~3.0 sec
* 2.2: ~2.5 sec
* 2.1: ~2.0 sec
* 2: ~1.5 sec
* **Daemon:** Delays decrease with decreasing parameter values.
* 2.4: ~4.0 sec
* 2.3: ~3.5 sec
* 2.2: ~3.0 sec
* 2.1: ~2.5 sec
* 2: ~0.5 sec
### Key Observations
* In both charts, decreasing the parameter value (from 2.4 to 2) generally leads to improved throughput and reduced packet delays across all protocols.
* Daemon consistently exhibits the highest throughput and lowest packet delays.
* OSPF, SPF, Q-R, and PQ-R show similar performance characteristics.
* AntNet has the lowest throughput and higher packet delays compared to other protocols.
### Interpretation
The data suggests a trade-off between parameter settings and network performance. Lower parameter values appear to optimize both throughput and delay. The Daemon protocol consistently outperforms others, indicating its superior efficiency in this network environment. The consistent trends across protocols suggest a fundamental relationship between the parameter and network characteristics. The large difference in performance between Daemon and AntNet suggests that AntNet may be less suited for this particular network configuration or workload. The inverse relationship between throughput and delay is expected; as throughput increases, delays generally decrease, indicating a more efficient network. The data could be used to inform parameter tuning for optimal network performance, with a strong recommendation to consider the Daemon protocol.