## Bar Charts: Network Protocol Performance Comparison
### Overview
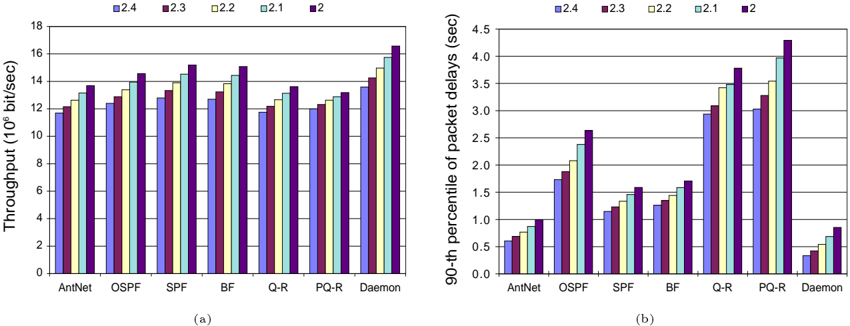
The image contains two side-by-side bar charts, labeled (a) and (b), comparing the performance of seven network routing protocols or algorithms across five different parameter settings. The charts share a common legend and x-axis categories but measure different performance metrics.
### Components/Axes
**Common Elements:**
* **Legend:** Positioned at the top center of each chart. It defines five data series, each corresponding to a numerical parameter value, represented by a distinct color:
* `2.4`: Light blue
* `2.3`: Maroon/Dark red
* `2.2`: Light yellow/cream
* `2.1`: Light cyan/aqua
* `2`: Dark purple
* **X-Axis (Both Charts):** Lists seven network protocols/algorithms. From left to right: `AntNet`, `OSPF`, `SPF`, `BF`, `Q-R`, `PQ-R`, `Daemon`.
* **Chart (a) - Left:**
* **Title/Y-Axis Label:** `Throughput (10^6 bit/sec)`
* **Y-Axis Scale:** Linear scale from 0 to 18, with major tick marks every 2 units.
* **Chart (b) - Right:**
* **Title/Y-Axis Label:** `90-th percentile of packet delays (sec)`
* **Y-Axis Scale:** Linear scale from 0.0 to 4.5, with major tick marks every 0.5 units.
### Detailed Analysis
**Chart (a): Throughput (10^6 bit/sec)**
For every protocol, throughput shows a consistent upward trend as the parameter value decreases from 2.4 to 2. The dark purple bar (parameter `2`) is always the tallest within each group.
* **AntNet:** Throughput increases from ~11.5 (2.4) to ~13.5 (2).
* **OSPF:** Throughput increases from ~12.0 (2.4) to ~14.5 (2).
* **SPF:** Throughput increases from ~12.8 (2.4) to ~15.0 (2).
* **BF:** Throughput increases from ~12.5 (2.4) to ~15.0 (2).
* **Q-R:** Throughput increases from ~11.5 (2.4) to ~13.5 (2).
* **PQ-R:** Throughput increases from ~11.8 (2.4) to ~13.2 (2).
* **Daemon:** Shows the highest overall throughput, increasing from ~13.8 (2.4) to ~16.5 (2).
**Chart (b): 90th Percentile of Packet Delays (sec)**
For six of the seven protocols (all except Daemon), delay shows a consistent upward trend as the parameter value decreases from 2.4 to 2. The dark purple bar (parameter `2`) is the tallest within these groups. Daemon exhibits the inverse trend.
* **AntNet:** Delay increases from ~0.6 (2.4) to ~1.0 (2).
* **OSPF:** Delay increases from ~1.7 (2.4) to ~2.6 (2).
* **SPF:** Delay increases from ~1.0 (2.4) to ~1.6 (2).
* **BF:** Delay increases from ~1.2 (2.4) to ~1.7 (2).
* **Q-R:** Delay increases from ~2.9 (2.4) to ~3.8 (2).
* **PQ-R:** Delay increases from ~3.0 (2.4) to ~4.3 (2).
* **Daemon:** Shows the lowest overall delays and an inverse trend. Delay *decreases* from ~0.9 (2.4) to ~0.3 (2).
### Key Observations
1. **Inverse Relationship:** There is a clear inverse relationship between the two metrics for most protocols. As the parameter value decreases (2.4 -> 2), throughput increases but so does the 90th percentile packet delay.
2. **Daemon's Anomaly:** The `Daemon` protocol is a significant outlier. It achieves the highest throughput *and* the lowest packet delays. Furthermore, its delay trend is opposite to all others: delays improve (decrease) as the parameter value decreases.
3. **Performance Hierarchy:** In terms of throughput, the general hierarchy from lowest to highest is: AntNet/Q-R/PQ-R < OSPF/SPF/BF < Daemon. For delay (excluding Daemon), the hierarchy from lowest to highest is: AntNet/SPF/BF < OSPF < Q-R < PQ-R.
4. **Parameter Sensitivity:** The `PQ-R` protocol shows the greatest sensitivity in delay to the parameter change, with its 90th percentile delay increasing by approximately 1.3 seconds from parameter 2.4 to 2.
### Interpretation
The data suggests a fundamental trade-off in network routing optimization for the tested protocols (AntNet through PQ-R): tuning the system for higher throughput (by moving from parameter 2.4 to 2) comes at the cost of increased tail latency (90th percentile delay). This is a classic performance trade-off in networking.
The `Daemon` protocol breaks this trade-off. Its superior performance on both metrics and its inverse delay trend suggest it employs a fundamentally different, and more effective, routing or scheduling algorithm under these test conditions. It manages to increase throughput while simultaneously reducing worst-case packet delays as the parameter is adjusted.
The parameter (labeled 2.4, 2.3, etc.) is likely a key configuration variable, such as a weight, timer, or threshold. The consistent directional trends across multiple protocols indicate it has a predictable and significant impact on system behavior. The charts effectively demonstrate that protocol choice (`Daemon`) can overcome the throughput-delay trade-off that constrains the other algorithms.