\n
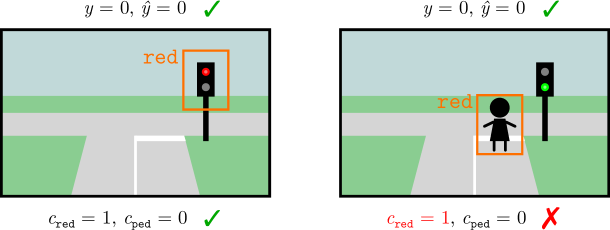
## Diagram: Traffic Light and Pedestrian Detection
### Overview
The image presents two side-by-side diagrams depicting street scenes with a traffic light and, in the second scene, a pedestrian. Each scene is annotated with bounding boxes around the traffic light or pedestrian, along with associated labels and evaluation metrics. The diagrams appear to be illustrating a scenario for object detection, specifically focusing on the detection of traffic lights and pedestrians.
### Components/Axes
The diagrams consist of the following elements:
* **Street Scene:** A simplified representation of a street with a road, sidewalk, and background greenery.
* **Traffic Light:** A traffic light pole with a red light in the first image and a green light in the second.
* **Pedestrian:** A silhouette of a person in the second image.
* **Bounding Boxes:** Orange rectangles highlighting the detected objects (traffic light or pedestrian).
* **Labels:** The text "red" is placed near the bounding boxes.
* **Evaluation Metrics:**
* `y = 0, ỹ = 0` (top of each image)
* `c_red = 1, c_ped = 0` (bottom of each image)
* **Checkmarks/Crosses:** Green checkmarks and a red cross indicating the success or failure of the detection.
### Detailed Analysis or Content Details
**Image 1 (Traffic Light):**
* The scene shows a traffic light with a red light.
* An orange bounding box surrounds the traffic light.
* The label "red" is positioned near the bounding box.
* The evaluation metrics are: `y = 0, ỹ = 0` and `c_red = 1, c_ped = 0`.
* A green checkmark indicates a successful detection.
**Image 2 (Pedestrian):**
* The scene shows a pedestrian crossing the street with a green traffic light.
* An orange bounding box surrounds the pedestrian.
* The label "red" is positioned near the bounding box.
* The evaluation metrics are: `y = 0, ỹ = 0` and `c_red = 1, c_ped = 0`.
* A red cross indicates a failed detection.
The variables used in the evaluation metrics appear to be:
* `y`: Likely represents a ground truth value.
* `ỹ`: Likely represents a predicted value.
* `c_red`: A binary indicator (1 or 0) for the presence of a red object (traffic light).
* `c_ped`: A binary indicator (1 or 0) for the presence of a pedestrian.
### Key Observations
* The first image shows a correct detection of the red traffic light, indicated by the checkmark.
* The second image shows a failure to detect the pedestrian, despite the presence of a pedestrian and a green light, indicated by the red cross.
* The label "red" is consistently used for both the traffic light and the pedestrian, which is potentially misleading.
* The evaluation metrics suggest that the system correctly identified the red traffic light (`c_red = 1`) but failed to identify the pedestrian (`c_ped = 0`).
* The `y = 0, ỹ = 0` metric is consistent across both images, suggesting it might be a baseline or a constant value.
### Interpretation
The diagrams illustrate a scenario where an object detection system successfully identifies a red traffic light but fails to detect a pedestrian. The use of the label "red" for both objects is confusing and suggests a potential issue with the labeling or the system's understanding of object classes. The evaluation metrics provide a quantitative assessment of the detection performance, highlighting the system's weakness in pedestrian detection. The `y = 0, ỹ = 0` metric could represent a confidence score or a similarity measure, but its meaning is unclear without further context. The diagrams likely represent a test case or a demonstration of the limitations of a specific object detection algorithm. The system appears to be biased towards detecting red objects, potentially due to the training data or the algorithm's design.