## Comparative Diagram: Traffic Light Classification Scenarios
### Overview
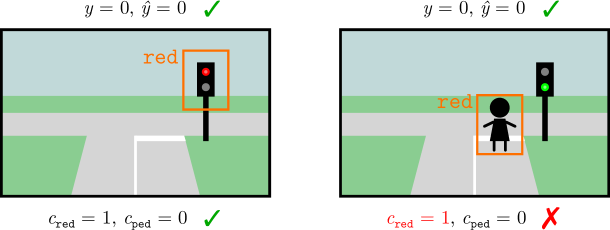
The image displays two side-by-side schematic diagrams illustrating traffic light and pedestrian scenarios, likely for evaluating a computer vision or machine learning model's classification performance. Each panel depicts a simplified intersection with a traffic light, a pedestrian crossing, and mathematical annotations indicating ground truth (`y`), model prediction (`ŷ`), and confidence or indicator variables (`c_red`, `c_ped`).
### Components/Axes
The image is divided into two distinct panels (left and right), each containing:
1. **Visual Scene:** A simplified top-down view of a road intersection with green grass areas, gray road surfaces, and a white pedestrian crossing line.
2. **Traffic Light:** A black pole-mounted traffic light.
3. **Pedestrian:** A black stick-figure icon (present only in the right panel).
4. **Highlight Box:** An orange rectangular bounding box around the primary object of interest (traffic light in left panel, pedestrian in right panel).
5. **Text Label:** The word "red" in orange text, positioned near the highlighted object.
6. **Mathematical Annotations:**
* **Top of each panel:** `y = 0, ŷ = 0` followed by a green checkmark (✓).
* **Bottom of each panel:** `c_red = 1, c_ped = 0` followed by a symbol (✓ or ✗).
### Detailed Analysis
**Left Panel (Correct Classification):**
* **Scene:** Traffic light shows a **red** illuminated circle. No pedestrian is present on the crossing.
* **Highlight & Label:** The orange box surrounds the traffic light. The orange text "red" is placed to its left.
* **Annotations:**
* Top: `y = 0, ŷ = 0` ✓. This indicates the ground truth label (`y`) and the model's prediction (`ŷ`) are both 0, which is correct (✓).
* Bottom: `c_red = 1, c_ped = 0` ✓. This suggests a confidence or indicator variable for "red light" (`c_red`) is active (1), and for "pedestrian" (`c_ped`) is inactive (0). This combination is marked as correct (✓).
**Right Panel (Incorrect Classification):**
* **Scene:** Traffic light shows a **green** illuminated circle. A pedestrian icon is present on the crossing.
* **Highlight & Label:** The orange box surrounds the **pedestrian**. The orange text "red" is placed to the left of the pedestrian, not the traffic light.
* **Annotations:**
* Top: `y = 0, ŷ = 0` ✓. The ground truth and prediction are again both 0, marked as correct.
* Bottom: `c_red = 1, c_ped = 0` ✗. The same variable state as the left panel (`c_red=1`, `c_ped=0`) is now marked as **incorrect** (✗).
### Key Observations
1. **Spatial Grounding Discrepancy:** In the right panel, the label "red" and the highlight box are associated with the pedestrian, not the traffic light which is actually green. This is a critical misalignment.
2. **Variable State Contradiction:** The variable state `c_red = 1, c_ped = 0` is consistent across both panels but is evaluated as correct (✓) in the left and incorrect (✗) in the right. This implies the *meaning* or *context* of these variables changes based on the visual scene, not just their values.
3. **Top-Level vs. Bottom-Level Evaluation:** The top annotation (`y=0, ŷ=0`) is marked correct in both cases, suggesting the model's final output (perhaps a binary "violation" or "stop" decision) is correct. The bottom annotation reveals an error in the model's *internal reasoning* or *intermediate feature detection* in the right panel.
### Interpretation
This diagram appears to be a **failure case analysis** for an AI system, likely one designed for traffic scene understanding. It demonstrates a scenario where the model arrives at the correct final prediction (`ŷ=0`) but for the wrong reasons.
* **Left Panel (Success):** The model correctly identifies the red light (`c_red=1`) and the absence of a pedestrian (`c_ped=0`), leading to a correct final output.
* **Right Panel (Failure):** The model incorrectly associates the "red" attribute with the pedestrian instead of the traffic light. It still outputs `c_red=1` (perhaps triggered by the pedestrian's presence or clothing) and `c_ped=0` (failing to detect the pedestrian as a distinct entity). While the final prediction `ŷ=0` might still be correct by chance (e.g., if a green light with a pedestrian also means "do not proceed"), the internal representation is flawed. The red "X" (✗) highlights this reasoning error.
The core message is that **accuracy in final output (`ŷ`) does not guarantee correctness in intermediate understanding (`c_red`, `c_ped`)**. The diagram emphasizes the importance of evaluating not just *what* a model decides, but *why* it decides it, using spatial grounding and attribute binding as key diagnostic tools.