## Diagram: Traffic Light and Pedestrian Compliance Scenarios
### Overview
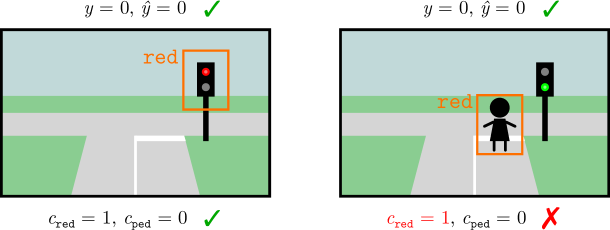
The image presents two side-by-side diagrams illustrating scenarios involving traffic lights and pedestrians. Each diagram includes labeled variables, color-coded indicators (checkmarks ✅ and X ❌), and visual elements (traffic lights, pedestrians, road markings). The diagrams compare correct and incorrect pedestrian behavior relative to traffic light states.
### Components/Axes
1. **Visual Elements**:
- **Traffic Lights**:
- Left diagram: Red light (labeled "red" in orange text).
- Right diagram: Green light (no label).
- **Pedestrians**:
- Left diagram: Pedestrian icon (black silhouette) outside a yellow boundary box.
- Right diagram: Pedestrian icon inside a yellow boundary box.
- **Road Markings**: White dashed lines indicating crosswalks.
- **Background**: Simplified green grass and gray road.
2. **Textual Labels**:
- **Top of Each Diagram**:
- Equations: `y = 0, ȳ = 0` (Greek letter y with macron).
- Checkmark ✅ (green) on the left, X ❌ (red) on the right.
- **Bottom of Each Diagram**:
- Variables: `c_red = 1, c_ped = 0` (subscripts "red" and "ped").
- Checkmark ✅ (green) on the left, X ❌ (red) on the right.
3. **Color Coding**:
- **Red**: Traffic light state (left diagram) and incorrect scenario (right diagram).
- **Green**: Checkmark ✅ (correct scenario) and traffic light state (right diagram).
- **Yellow**: Boundary boxes around pedestrians.
### Detailed Analysis
- **Left Diagram**:
- Traffic light is red (`c_red = 1`).
- Pedestrian is outside the crosswalk (`c_ped = 0`).
- Equations `y = 0, ȳ = 0` suggest no change in state (`y`) or its derivative (`ȳ`).
- ✅ Checkmark indicates compliance with rules.
- **Right Diagram**:
- Traffic light is green (implied by absence of red label).
- Pedestrian is inside the crosswalk (`c_ped = 0` despite visual contradiction).
- Equations `y = 0, ȳ = 0` remain unchanged.
- ❌ X indicates violation of rules (pedestrian crossing on red light).
### Key Observations
1. **Contradiction in Right Diagram**:
- Despite `c_ped = 0` (no pedestrian), the pedestrian icon is inside the crosswalk. This inconsistency suggests a labeling error or misalignment between variables and visuals.
2. **Variable Definitions**:
- `c_red` and `c_ped` are binary flags (1 = present, 0 = absent).
- `y` and `ȳ` likely represent system states (e.g., traffic light status) and their rates of change.
3. **Color-Label Alignment**:
- Red traffic light (`c_red = 1`) aligns with the "red" label.
- Green checkmark ✅ (left) and red X ❌ (right) correspond to compliance status.
### Interpretation
The diagrams model a rule-based system where pedestrians must not cross when the traffic light is red. The left scenario adheres to this rule (`c_red = 1, c_ped = 0`), while the right scenario violates it (pedestrian crosses despite `c_red = 1`). The equations `y = 0, ȳ = 0` may represent a steady-state condition where no active changes occur in the system.
**Notable Anomaly**:
- The right diagram’s `c_ped = 0` conflicts with the visual presence of a pedestrian in the crosswalk. This discrepancy highlights a potential flaw in the variable definitions or diagrammatic representation.
**Underlying Logic**:
- The system prioritizes traffic light compliance over pedestrian presence. Even if no pedestrians are present (`c_ped = 0`), crossing on a red light (`c_red = 1`) is still penalized (❌).
- The use of `y` and `ȳ` suggests a dynamic system where state changes (`ȳ`) are monitored to enforce rules.