\n
## Line Chart: I-Don't-Know Rate vs. Layer for Llama Models
### Overview
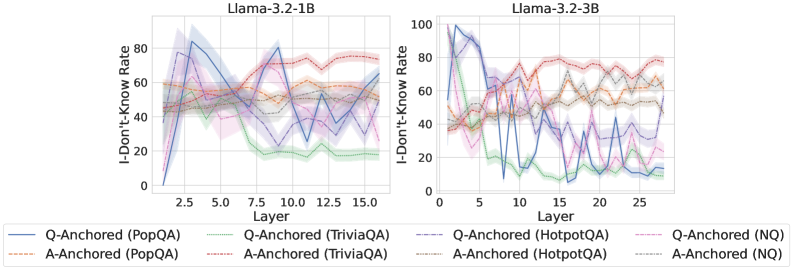
The image presents two line charts, side-by-side, visualizing the "I-Don't-Know Rate" against the "Layer" number for two different Llama models: Llama-3.2-1B and Llama-3.2-3B. Each chart displays multiple lines representing different question-answering datasets and anchoring methods. The charts are designed to compare how the rate of the model failing to answer questions (I-Don't-Know Rate) changes as the model's layers increase.
### Components/Axes
* **X-axis:** "Layer" - Ranges from approximately 2 to 15 for the Llama-3.2-1B chart and from approximately 2 to 27 for the Llama-3.2-3B chart.
* **Y-axis:** "I-Don't-Know Rate" - Ranges from 0 to 80 for the Llama-3.2-1B chart and from 0 to 100 for the Llama-3.2-3B chart.
* **Legend:** Located at the bottom of the image, containing the following labels and corresponding line styles/colors:
* Q-Anchored (PopQA) - Solid Blue Line
* A-Anchored (PopQA) - Dashed Orange Line
* Q-Anchored (TriviaQA) - Solid Red Line
* A-Anchored (TriviaQA) - Dashed Green Line
* Q-Anchored (HotpotQA) - Dashed Blue Line
* A-Anchored (HotpotQA) - Dashed Orange Line
* Q-Anchored (NQ) - Solid Green Line
* A-Anchored (NQ) - Dashed Purple Line
* **Titles:**
* Left Chart: "Llama-3.2-1B"
* Right Chart: "Llama-3.2-3B"
### Detailed Analysis or Content Details
**Llama-3.2-1B Chart:**
* **Q-Anchored (PopQA):** The line starts at approximately 10 at Layer 2, peaks at approximately 80 at Layer 2.5, then declines to approximately 50 at Layer 15.
* **A-Anchored (PopQA):** The line starts at approximately 50 at Layer 2, fluctuates between approximately 50 and 70 until Layer 15.
* **Q-Anchored (TriviaQA):** The line starts at approximately 60 at Layer 2, peaks at approximately 75 at Layer 2.5, then declines to approximately 60 at Layer 15.
* **A-Anchored (TriviaQA):** The line starts at approximately 50 at Layer 2, fluctuates between approximately 50 and 65 until Layer 15.
* **Q-Anchored (HotpotQA):** The line starts at approximately 60 at Layer 2, fluctuates between approximately 50 and 70 until Layer 15.
* **A-Anchored (HotpotQA):** The line starts at approximately 50 at Layer 2, fluctuates between approximately 50 and 65 until Layer 15.
* **Q-Anchored (NQ):** The line starts at approximately 20 at Layer 2, increases to approximately 50 at Layer 7.5, then declines to approximately 30 at Layer 15.
* **A-Anchored (NQ):** The line starts at approximately 50 at Layer 2, fluctuates between approximately 40 and 60 until Layer 15.
**Llama-3.2-3B Chart:**
* **Q-Anchored (PopQA):** The line starts at approximately 80 at Layer 2, declines to approximately 20 at Layer 10, then fluctuates between approximately 20 and 40 until Layer 27.
* **A-Anchored (PopQA):** The line starts at approximately 60 at Layer 2, fluctuates between approximately 40 and 60 until Layer 27.
* **Q-Anchored (TriviaQA):** The line starts at approximately 70 at Layer 2, declines to approximately 40 at Layer 10, then fluctuates between approximately 40 and 60 until Layer 27.
* **A-Anchored (TriviaQA):** The line starts at approximately 50 at Layer 2, fluctuates between approximately 40 and 60 until Layer 27.
* **Q-Anchored (HotpotQA):** The line starts at approximately 70 at Layer 2, declines to approximately 40 at Layer 10, then fluctuates between approximately 40 and 60 until Layer 27.
* **A-Anchored (HotpotQA):** The line starts at approximately 50 at Layer 2, fluctuates between approximately 40 and 60 until Layer 27.
* **Q-Anchored (NQ):** The line starts at approximately 40 at Layer 2, declines to approximately 10 at Layer 10, then fluctuates between approximately 10 and 30 until Layer 27.
* **A-Anchored (NQ):** The line starts at approximately 50 at Layer 2, fluctuates between approximately 40 and 60 until Layer 27.
### Key Observations
* In both charts, the "Q-Anchored (PopQA)" line exhibits a significant initial drop in I-Don't-Know Rate as the layer number increases.
* The "A-Anchored" lines generally remain more stable than the "Q-Anchored" lines across all datasets.
* The Llama-3.2-3B model generally shows a lower I-Don't-Know Rate than the Llama-3.2-1B model, particularly after the initial layers.
* The I-Don't-Know Rate for the Llama-3.2-1B model appears to stabilize around 50-70 after Layer 7.5, while the Llama-3.2-3B model stabilizes around 40-60 after Layer 10.
### Interpretation
The charts demonstrate the impact of model size (number of parameters) and anchoring method on the model's ability to answer questions. The larger Llama-3.2-3B model consistently exhibits a lower I-Don't-Know Rate, indicating improved knowledge and reasoning capabilities. The "Q-Anchored" method, which likely involves prompting the model with a question, initially shows a higher I-Don't-Know Rate but then improves with increasing layers, suggesting the model learns to better understand and respond to questions as it processes more information. The "A-Anchored" method, which may involve providing the model with an answer or context, maintains a more stable I-Don't-Know Rate, indicating a more consistent level of performance. The initial spike in I-Don't-Know Rate for the "Q-Anchored" lines could be due to the model struggling with the initial layers or the complexity of the questions. The stabilization of the lines after a certain number of layers suggests that the model reaches a point of diminishing returns in terms of knowledge acquisition. The differences in I-Don't-Know Rates across different datasets (PopQA, TriviaQA, HotpotQA, NQ) likely reflect the varying difficulty and complexity of the questions in each dataset.