## Line Charts: I-Don't-Know Rate Across Model Layers for Llama-3.2 Models
### Overview
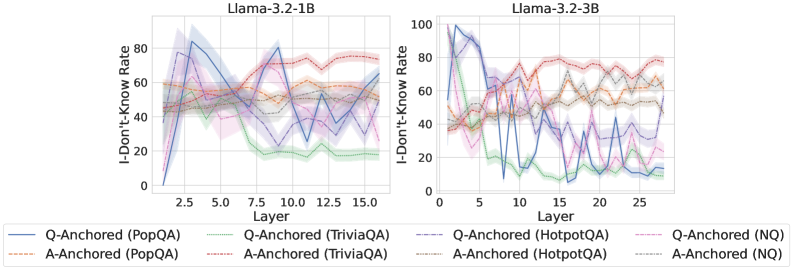
The image displays two side-by-side line charts comparing the "I-Don't-Know Rate" across different layers of two language models: Llama-3.2-1B (left) and Llama-3.2-3B (right). The charts analyze how the model's tendency to produce an "I don't know" response varies by layer, depending on the question-answering method (Q-Anchored vs. A-Anchored) and the dataset used (PopQA, TriviaQA, HotpotQA, NQ).
### Components/Axes
* **Titles:**
* Left Chart: `Llama-3.2-1B`
* Right Chart: `Llama-3.2-3B`
* **Y-Axis (Both Charts):** Label: `I-Don't-Know Rate`. Scale: 0 to 100, with major ticks at 0, 20, 40, 60, 80, 100.
* **X-Axis (Both Charts):** Label: `Layer`.
* Left Chart Scale: 0 to ~16, with major ticks at 2.5, 5.0, 7.5, 10.0, 12.5, 15.0.
* Right Chart Scale: 0 to ~28, with major ticks at 0, 5, 10, 15, 20, 25.
* **Legend (Bottom, spanning both charts):** Contains 8 entries, differentiating lines by color and style (solid vs. dashed).
* **Solid Lines (Q-Anchored):**
* Blue: `Q-Anchored (PopQA)`
* Green: `Q-Anchored (TriviaQA)`
* Purple: `Q-Anchored (HotpotQA)`
* Pink: `Q-Anchored (NQ)`
* **Dashed Lines (A-Anchored):**
* Orange: `A-Anchored (PopQA)`
* Red: `A-Anchored (TriviaQA)`
* Brown: `A-Anchored (HotpotQA)`
* Gray: `A-Anchored (NQ)`
### Detailed Analysis
**Llama-3.2-1B (Left Chart):**
* **General Trend:** A-Anchored methods (dashed lines) generally maintain a higher and more stable I-Don't-Know Rate (mostly between 40-80) across layers. Q-Anchored methods (solid lines) start lower, exhibit significant volatility, and often show a declining trend in later layers.
* **Q-Anchored Series:**
* **PopQA (Blue, Solid):** Starts near 0, spikes sharply to ~80 at layer ~2.5, then fluctuates dramatically, ending near 60 at layer 15.
* **TriviaQA (Green, Solid):** Starts around 40, peaks near 60 at layer ~5, then declines steadily to ~20 by layer 15.
* **HotpotQA (Purple, Solid) & NQ (Pink, Solid):** Both start between 20-40, show high volatility with multiple peaks and troughs, and end in the 20-40 range.
* **A-Anchored Series:**
* **PopQA (Orange, Dashed):** Relatively stable, hovering between 50-65.
* **TriviaQA (Red, Dashed):** The highest and most stable series, consistently between 60-80.
* **HotpotQA (Brown, Dashed) & NQ (Gray, Dashed):** Both are stable and intertwined, generally ranging from 40-60.
**Llama-3.2-3B (Right Chart):**
* **General Trend:** Similar pattern to the 1B model but with more pronounced volatility in the Q-Anchored lines and a wider layer range. A-Anchored lines remain higher and more stable.
* **Q-Anchored Series:**
* **PopQA (Blue, Solid):** Extremely volatile. Starts near 0, spikes to ~100 at layer ~2, crashes to ~10 at layer ~5, then oscillates wildly between 20-80.
* **TriviaQA (Green, Solid):** Starts near 40, peaks at ~70 around layer 5, then shows a general decline with volatility, ending near 10 at layer 27.
* **HotpotQA (Purple, Solid) & NQ (Pink, Solid):** Both show high volatility, starting low (20-40), with multiple peaks often reaching 60-80, and ending in the 20-50 range.
* **A-Anchored Series:**
* **PopQA (Orange, Dashed):** Stable, mostly between 50-70.
* **TriviaQA (Red, Dashed):** Again the highest, stable between 70-80.
* **HotpotQA (Brown, Dashed) & NQ (Gray, Dashed):** Stable and closely grouped, ranging from 50-70.
### Key Observations
1. **Method Dichotomy:** There is a clear and consistent separation between Q-Anchored (solid) and A-Anchored (dashed) lines across both models. A-Anchored methods yield significantly higher and more stable "I-Don't-Know" rates.
2. **Dataset Hierarchy:** For A-Anchored methods, the dataset order from highest to lowest rate is consistent: TriviaQA (Red) > PopQA (Orange) ≈ HotpotQA (Brown) ≈ NQ (Gray).
3. **Model Scale Effect:** The larger model (3B) exhibits greater volatility in the Q-Anchored responses, particularly for PopQA, suggesting more dramatic shifts in internal representation or confidence across its deeper layers.
4. **Layer Sensitivity:** Q-Anchored performance is highly sensitive to specific layers, with sharp peaks and troughs, whereas A-Anchored performance is largely layer-invariant.
### Interpretation
The data suggests a fundamental difference in how the model processes questions versus answers when generating abstention responses. **A-Anchored prompting** (likely conditioning on the answer format) leads to a consistent, high baseline of "I don't know" responses, implying it reliably triggers a cautious or abstention mode regardless of the layer or specific knowledge domain (dataset). This could be useful for applications requiring high precision and low hallucination rates.
In contrast, **Q-Anchored prompting** (conditioning on the question) results in a volatile, layer-dependent abstention rate. The early-layer spikes might indicate initial uncertainty processing, while the mid-layer peaks could correspond to specific knowledge retrieval or integration points. The decline in later layers for some datasets (e.g., TriviaQA) might suggest the model becomes more confident (or less cautious) in its final representations. The extreme volatility in the 3B model's Q-Anchored PopQA line is a notable anomaly, indicating that for certain datasets, the larger model's internal decision-making regarding abstention is highly unstable across its processing depth.
**In essence, the choice of anchoring method is a more powerful lever for controlling the model's abstention behavior than the specific layer or model size, with A-Anchored methods providing a predictable, high-abstention profile.**