## Line Graph: I-Don't-Know Rate Across LLaMA Model Layers
### Overview
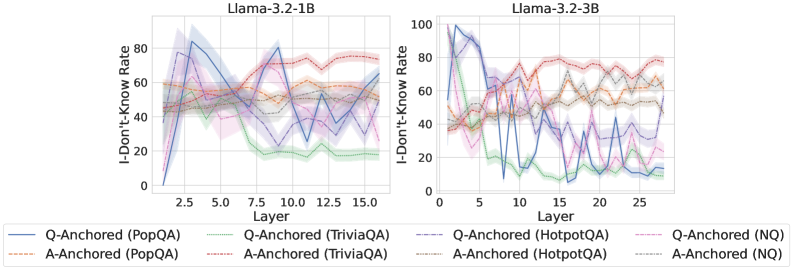
The image contains two line graphs comparing the "I-Don't-Know Rate" (percentage of instances where models abstained from answering) across different layers of LLaMA-3.2-1B and LLaMA-3.2-3B models. Each graph includes six data series representing combinations of question-answering (QA) datasets and anchoring methods (Q-Anchored vs. A-Anchored). The graphs show significant variability in I-Don't-Know rates across layers, with distinct patterns emerging for different datasets and anchoring strategies.
### Components/Axes
- **X-Axis (Layer)**:
- LLaMA-3.2-1B: 2.5 → 15.0 (discrete layer markers)
- LLaMA-3.2-3B: 0 → 25 (discrete layer markers)
- **Y-Axis (I-Don't-Know Rate)**: 0% → 100% (continuous scale)
- **Legend**:
- **Q-Anchored (PopQA)**: Solid blue line
- **Q-Anchored (TriviaQA)**: Dashed green line
- **Q-Anchored (HotpotQA)**: Dotted purple line
- **Q-Anchored (NQ)**: Dash-dot pink line
- **A-Anchored (PopQA)**: Solid orange line
- **A-Anchored (TriviaQA)**: Dashed brown line
- **A-Anchored (HotpotQA)**: Dotted gray line
- **A-Anchored (NQ)**: Dash-dot red line
- **Shading**: Confidence intervals (95% CI) around each line
### Detailed Analysis
#### LLaMA-3.2-1B Graph
1. **Q-Anchored (PopQA)**:
- Starts at ~60% (layer 2.5), peaks at ~80% (layer 5), then declines to ~40% (layer 15)
- Sharp drop between layers 5-7.5
2. **Q-Anchored (TriviaQA)**:
- Starts at ~50%, rises to ~70% (layer 7.5), then declines to ~30% (layer 15)
- High variability between layers 7.5-10
3. **Q-Anchored (HotpotQA)**:
- Starts at ~40%, peaks at ~90% (layer 5), then declines to ~20% (layer 15)
- Extreme volatility between layers 2.5-10
4. **Q-Anchored (NQ)**:
- Starts at ~55%, fluctuates between 40-65% (layers 2.5-12.5), then stabilizes at ~50%
5. **A-Anchored (PopQA)**:
- Starts at ~50%, rises to ~70% (layer 7.5), then declines to ~55% (layer 15)
- Smooth U-shaped curve
6. **A-Anchored (TriviaQA)**:
- Starts at ~45%, rises to ~65% (layer 5), then declines to ~40% (layer 15)
- Moderate volatility
7. **A-Anchored (HotpotQA)**:
- Starts at ~35%, peaks at ~85% (layer 5), then declines to ~30% (layer 15)
- Extreme volatility similar to Q-Anchored (HotpotQA)
8. **A-Anchored (NQ)**:
- Starts at ~50%, fluctuates between 40-60% (layers 2.5-15)
#### LLaMA-3.2-3B Graph
1. **Q-Anchored (PopQA)**:
- Starts at ~70%, peaks at ~95% (layer 5), then declines to ~50% (layer 25)
- Sharp drop between layers 5-10
2. **Q-Anchored (TriviaQA)**:
- Starts at ~60%, rises to ~80% (layer 10), then declines to ~40% (layer 25)
- High variability between layers 10-15
3. **Q-Anchored (HotpotQA)**:
- Starts at ~50%, peaks at ~100% (layer 5), then declines to ~20% (layer 25)
- Extreme volatility with multiple peaks
4. **Q-Anchored (NQ)**:
- Starts at ~65%, fluctuates between 50-80% (layers 0-20), then stabilizes at ~60%
5. **A-Anchored (PopQA)**:
- Starts at ~60%, rises to ~80% (layer 10), then declines to ~65% (layer 25)
- Smooth U-shaped curve
6. **A-Anchored (TriviaQA)**:
- Starts at ~55%, rises to ~75% (layer 15), then declines to ~50% (layer 25)
- Moderate volatility
7. **A-Anchored (HotpotQA)**:
- Starts at ~45%, peaks at ~95% (layer 5), then declines to ~40% (layer 25)
- Extreme volatility similar to Q-Anchored (HotpotQA)
8. **A-Anchored (NQ)**:
- Starts at ~55%, fluctuates between 45-70% (layers 0-25)
### Key Observations
1. **Anchoring Method Impact**:
- A-Anchored methods generally show more stable I-Don't-Know rates than Q-Anchored methods
- Q-Anchored (HotpotQA) exhibits the most extreme volatility in both models
2. **Model Size Differences**:
- LLaMA-3.2-3B shows higher baseline I-Don't-Know rates (60-80% vs 40-70% in 1B model)
- 3B model has more pronounced layer-specific variability
3. **Dataset-Specific Patterns**:
- HotpotQA consistently shows the highest I-Don't-Know rates across all anchoring methods
- NQ dataset demonstrates the most stable performance in both models
4. **Layer-Specific Trends**:
- Layers 5-10 consistently show peak I-Don't-Know rates
- Final layers (12.5-15 for 1B, 20-25 for 3B) show significant drops
### Interpretation
The data suggests that anchoring methods significantly influence model uncertainty patterns. A-Anchored methods demonstrate greater stability across layers, potentially indicating better generalization. Q-Anchored methods, particularly with HotpotQA, show extreme volatility suggesting sensitivity to layer depth. The 3B model's larger architecture correlates with higher baseline uncertainty but more pronounced layer-specific patterns. The consistent peaks at layers 5-10 across datasets may indicate critical processing stages where models are most likely to abstain from answering. The stability of NQ dataset results across anchoring methods suggests it may be less sensitive to model architecture variations. These patterns could inform model design choices for question-answering systems, particularly regarding layer selection and anchoring strategies.