## Bar and Line Chart: Gradient Size and Variance vs. Epochs
### Overview
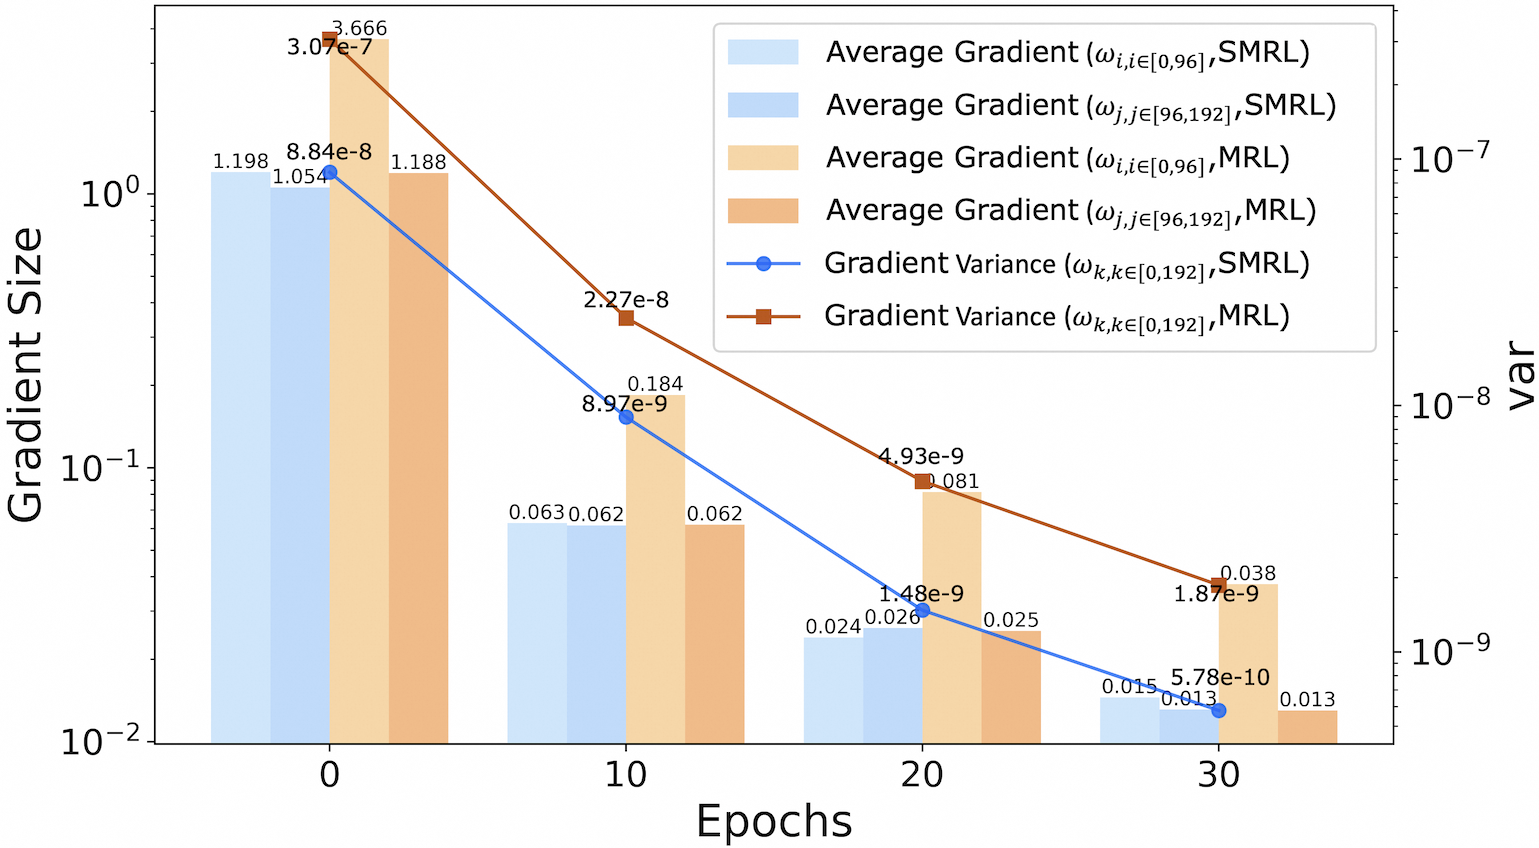
The image is a combination of a bar chart and a line chart, displaying the average gradient and gradient variance for two different models (SMRL and MRL) across epochs. The x-axis represents epochs (0, 10, 20, 30), while the left y-axis (Gradient Size) is on a logarithmic scale. The right y-axis (var) represents the gradient variance, also on a logarithmic scale. The chart compares the performance of SMRL and MRL models by showing how their average gradient and gradient variance change over training epochs.
### Components/Axes
* **X-axis:** Epochs, with markers at 0, 10, 20, and 30.
* **Left Y-axis:** Gradient Size, logarithmic scale from 10^-2 to 10^0 (0.01 to 1).
* **Right Y-axis:** var (Gradient Variance), logarithmic scale from 10^-9 to 10^-7.
* **Legend (top-right):**
* Light Blue: Average Gradient (ω<sub>i,i∈[0,96]</sub>, SMRL)
* Blue: Average Gradient (ω<sub>j,j∈[96,192]</sub>, SMRL)
* Light Orange: Average Gradient (ω<sub>i,i∈[0,96]</sub>, MRL)
* Orange: Average Gradient (ω<sub>j,j∈[96,192]</sub>, MRL)
* Blue Line with Circle Markers: Gradient Variance (ω<sub>k,k∈[0,192]</sub>, SMRL)
* Brown Line with Square Markers: Gradient Variance (ω<sub>k,k∈[0,192]</sub>, MRL)
### Detailed Analysis
#### Average Gradient (Bar Chart)
* **SMRL (ω<sub>i,i∈[0,96]</sub>, Light Blue):**
* Epoch 0: 1.198
* Epoch 10: 0.063
* Epoch 20: 0.024
* Epoch 30: 0.015
* Trend: Decreasing
* **SMRL (ω<sub>j,j∈[96,192]</sub>, Blue):**
* Epoch 0: 1.054
* Epoch 10: 0.062
* Epoch 20: 0.026
* Epoch 30: 0.013
* Trend: Decreasing
* **MRL (ω<sub>i,i∈[0,96]</sub>, Light Orange):**
* Epoch 0: 1.188
* Epoch 10: 0.184
* Epoch 20: 0.081
* Epoch 30: 0.038
* Trend: Decreasing
* **MRL (ω<sub>j,j∈[96,192]</sub>, Orange):**
* Epoch 0: 3.666
* Epoch 10: 0.062
* Epoch 20: 0.025
* Epoch 30: 0.013
* Trend: Decreasing
#### Gradient Variance (Line Chart)
* **SMRL (ω<sub>k,k∈[0,192]</sub>, Blue Line):**
* Epoch 0: 8.84e-8
* Epoch 10: 8.97e-9
* Epoch 20: 1.48e-9
* Epoch 30: 5.78e-10
* Trend: Decreasing
* **MRL (ω<sub>k,k∈[0,192]</sub>, Brown Line):**
* Epoch 0: 3.07e-7
* Epoch 10: 2.27e-8
* Epoch 20: 4.93e-9
* Epoch 30: 1.87e-9
* Trend: Decreasing
### Key Observations
* The average gradient for both SMRL and MRL decreases significantly over the epochs.
* The gradient variance for both SMRL and MRL also decreases over the epochs.
* The initial gradient size at epoch 0 is higher for MRL (ω<sub>j,j∈[96,192]</sub>) compared to other average gradients.
* The gradient variance for MRL is higher than SMRL at the beginning, but both converge to lower values.
### Interpretation
The chart illustrates the training behavior of SMRL and MRL models, showing how the average gradient and gradient variance change as the models are trained over epochs. The decreasing trend in both average gradient and gradient variance suggests that the models are learning and converging towards a stable state. The higher initial gradient variance for MRL might indicate a more unstable initial state or a different learning dynamic compared to SMRL. The convergence of both models to lower gradient variance values indicates that both models are becoming more stable as training progresses. The data suggests that both models are effectively learning, with the gradient size and variance decreasing as the number of epochs increases.