\n
## Chart: Gradient Size and Variance vs. Epochs
### Overview
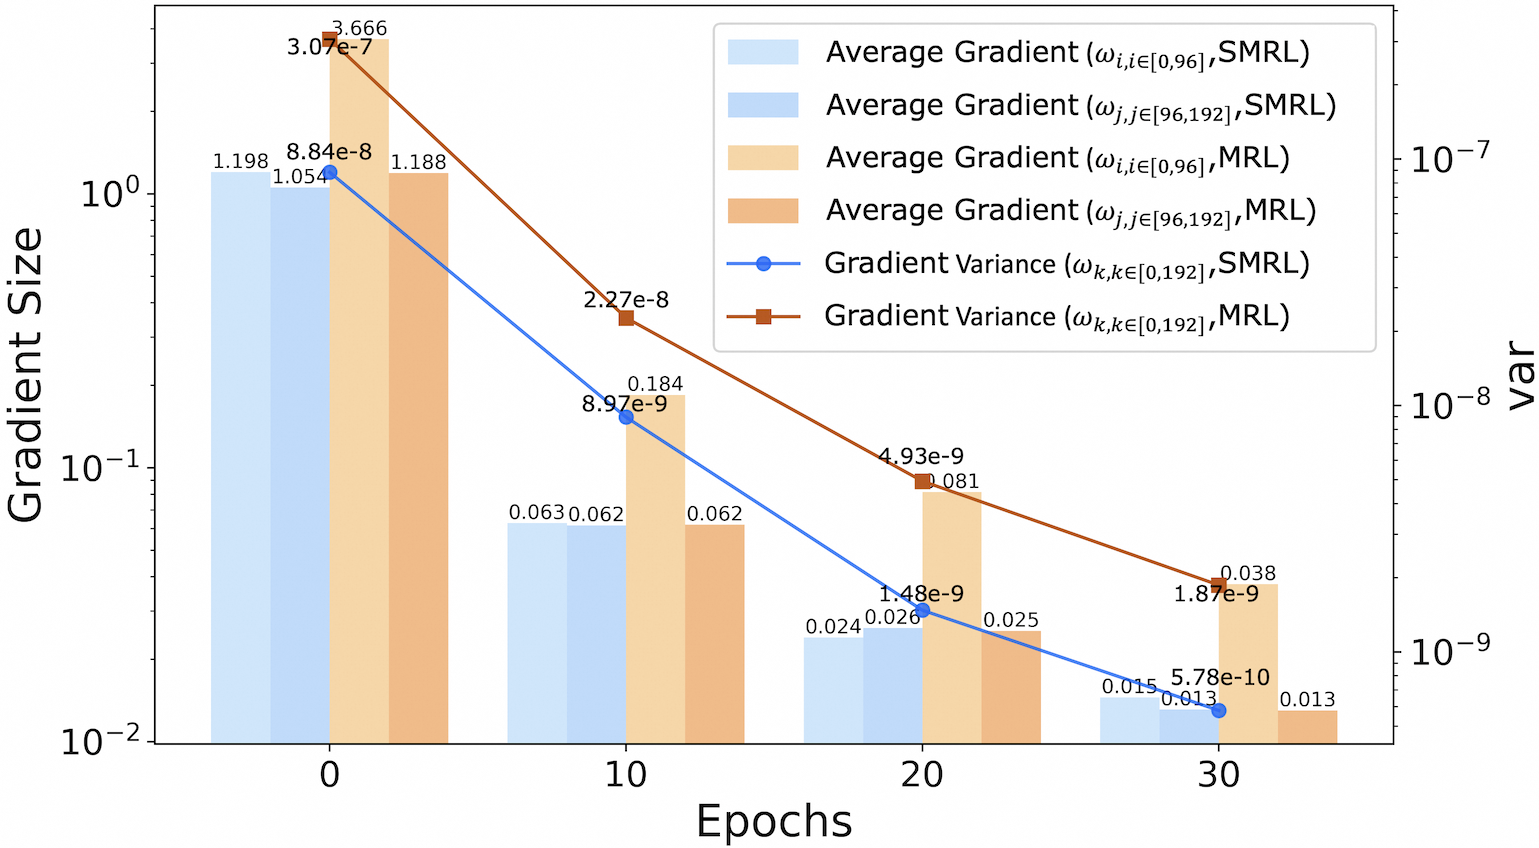
The image presents a chart illustrating the relationship between Epochs and both Gradient Size and Gradient Variance. The chart uses a dual y-axis, with the left axis representing Gradient Size (on a logarithmic scale) and the right axis representing Variance (also on a logarithmic scale). Multiple lines depict the Average Gradient for different configurations, and two lines show the Gradient Variance for different configurations.
### Components/Axes
* **X-axis:** Epochs, ranging from approximately -2 to 32.
* **Y-axis (Left):** Gradient Size, logarithmic scale from 10<sup>-2</sup> to 10<sup>1</sup>. Labeled "Gradient Size".
* **Y-axis (Right):** Variance, logarithmic scale from 10<sup>-10</sup> to 10<sup>-7</sup>. Labeled "var".
* **Legend:** Located in the top-right corner. Contains the following entries with corresponding colors:
* Average Gradient (ω<sub>i,j∈[0.96]</sub>,SMRL) - Light Blue
* Average Gradient (ω<sub>i,j∈[96,192]</sub>,SMRL) - Pale Orange
* Average Gradient (ω<sub>i,j∈[0.96]</sub>,MRL) - Light Brown
* Average Gradient (ω<sub>i,j∈[96,192]</sub>,MRL) - Dark Brown
* Gradient Variance (ω<sub>k,k∈[0.192]</sub>,SMRL) - Blue Circles
* Gradient Variance (ω<sub>k,k∈[0.192]</sub>,MRL) - Red Squares
### Detailed Analysis
The chart displays several lines representing different configurations.
**Average Gradient Lines:**
* **Light Blue Line (ω<sub>i,j∈[0.96]</sub>,SMRL):** Starts at approximately 3.666 x 10<sup>-7</sup> at Epoch -2, decreases rapidly to approximately 1.188 x 10<sup>-7</sup> at Epoch 0, and continues to decrease to approximately 0.038 x 10<sup>-7</sup> (3.8 x 10<sup>-9</sup>) at Epoch 30. The line exhibits a steep downward slope initially, which gradually flattens.
* **Pale Orange Line (ω<sub>i,j∈[96,192]</sub>,SMRL):** Starts at approximately 1.198 x 10<sup>-7</sup> at Epoch -2, decreases to approximately 1.054 x 10<sup>-7</sup> at Epoch 0, and continues to decrease to approximately 0.013 x 10<sup>-7</sup> (1.3 x 10<sup>-9</sup>) at Epoch 30. Similar to the light blue line, it shows a decreasing trend with a flattening slope.
* **Light Brown Line (ω<sub>i,j∈[0.96]</sub>,MRL):** Starts at approximately 8.84 x 10<sup>-8</sup> at Epoch -2, decreases to approximately 1.188 x 10<sup>-7</sup> at Epoch 0, and continues to decrease to approximately 0.025 x 10<sup>-7</sup> (2.5 x 10<sup>-9</sup>) at Epoch 30.
* **Dark Brown Line (ω<sub>i,j∈[96,192]</sub>,MRL):** Starts at approximately 3.666 x 10<sup>-7</sup> at Epoch -2, decreases to approximately 0.081 x 10<sup>-7</sup> (8.1 x 10<sup>-9</sup>) at Epoch 20, and continues to decrease to approximately 0.013 x 10<sup>-7</sup> (1.3 x 10<sup>-9</sup>) at Epoch 30.
**Gradient Variance Lines:**
* **Blue Circles (ω<sub>k,k∈[0.192]</sub>,SMRL):** Starts at approximately 2.27e-8 at Epoch 10, decreases to approximately 1.48e-9 at Epoch 20, and continues to decrease to approximately 0.024 x 10<sup>-9</sup> (2.4 x 10<sup>-11</sup>) at Epoch 30. The line shows a consistent downward trend.
* **Red Squares (ω<sub>k,k∈[0.192]</sub>,MRL):** Starts at approximately 0.184 x 10<sup>-7</sup> (1.84 x 10<sup>-8</sup>) at Epoch 10, decreases to approximately 4.93e-9 at Epoch 20, and continues to decrease to approximately 0.038 x 10<sup>-9</sup> (3.8 x 10<sup>-11</sup>) at Epoch 30. The line also shows a consistent downward trend.
### Key Observations
* All lines exhibit a decreasing trend as Epochs increase, indicating that both Gradient Size and Gradient Variance generally decrease with training.
* The Average Gradient lines (all colors) are significantly higher in magnitude than the Gradient Variance lines (blue and red).
* The lines representing the MRL configuration (light brown and dark brown) generally have lower values than those representing the SMRL configuration (light blue and pale orange) for Average Gradient.
* The Gradient Variance lines for both SMRL and MRL configurations show similar decreasing trends.
* The initial values for the Average Gradient lines are quite high, but they rapidly decrease with increasing Epochs.
### Interpretation
The chart demonstrates the typical behavior of gradient descent during training. As the model trains (Epochs increase), the gradients generally decrease in size, indicating that the model is converging towards a minimum of the loss function. The decreasing variance suggests that the gradients are becoming more consistent, which is also a sign of convergence.
The differences between the SMRL and MRL configurations suggest that the SMRL configuration may require larger gradients initially, but both configurations ultimately converge to similar levels of gradient size and variance. The logarithmic scales used for both axes emphasize the significant reduction in gradient size and variance over the training process. The initial high gradient values could indicate a large initial error or a steep learning rate. The flattening of the curves towards the end of the training process suggests that the model is approaching a stable state. The consistent downward trend in variance indicates that the training process is becoming more stable and less sensitive to individual data points.