## Bar Chart with Line Overlays: Gradient Size and Variance Across Epochs
### Overview
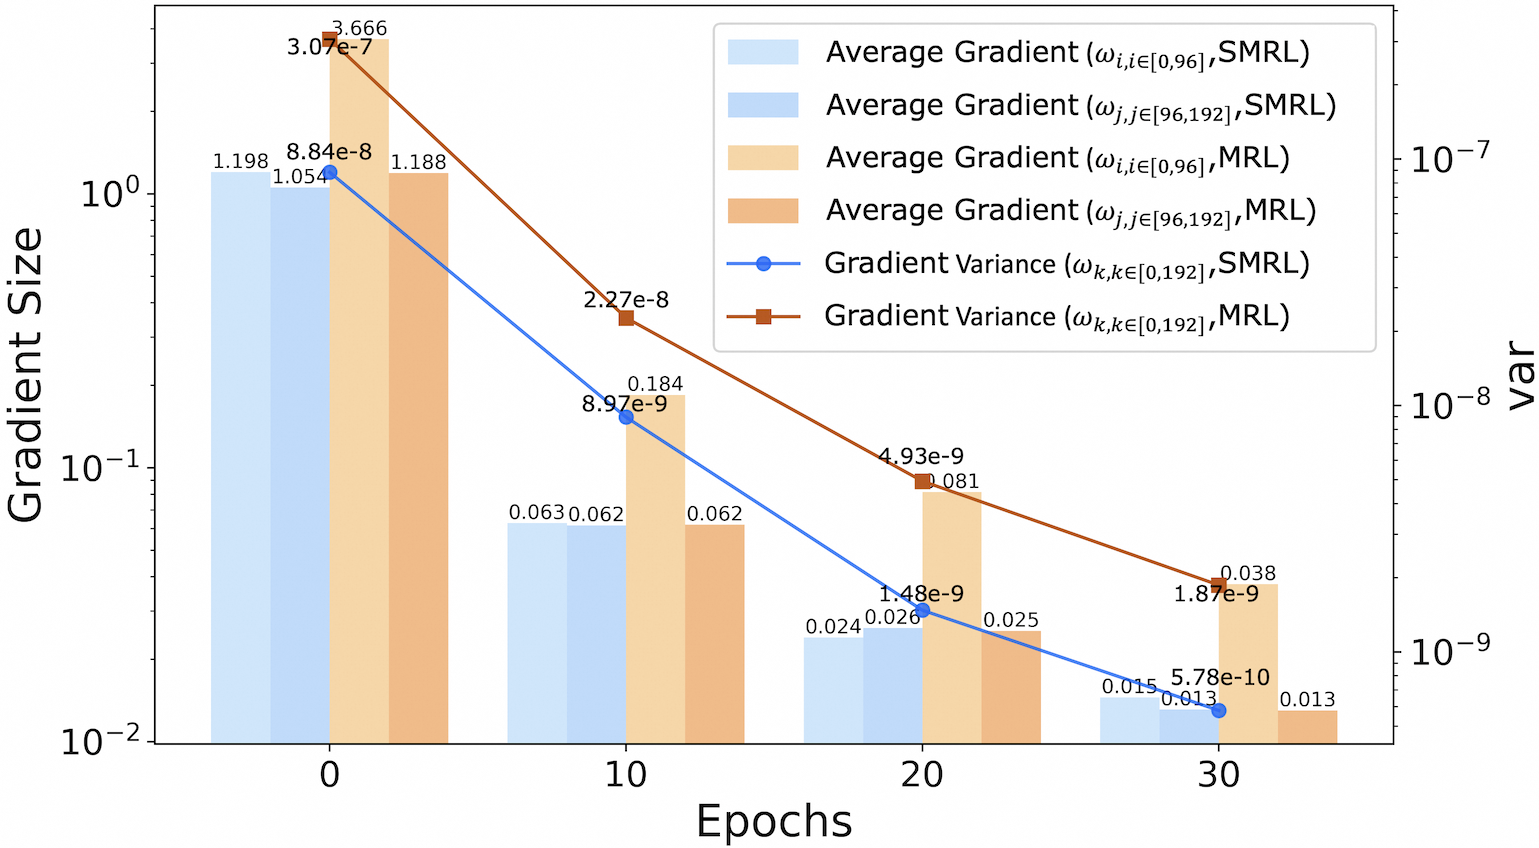
The image is a combined bar chart and line graph visualizing gradient size and variance across 31 epochs (0, 10, 20, 30). The chart compares two optimization methods (SMRL and MRL) using gradient metrics. Gradient size is plotted on a logarithmic scale (10⁻² to 10⁰) on the left y-axis, while gradient variance uses a secondary logarithmic scale (10⁻⁹ to 10⁻⁷) on the right y-axis. The x-axis represents training epochs.
### Components/Axes
- **X-axis**: Epochs (0, 10, 20, 30)
- **Left Y-axis**: Gradient Size (log scale: 10⁻² to 10⁰)
- **Right Y-axis**: Gradient Variance (log scale: 10⁻⁹ to 10⁻⁷)
- **Legend**:
- Light blue: Average Gradient (ωᵢ,ᵢ∈[0,96], SMRL)
- Blue: Average Gradient (ωⱼ,ⱼ∈[96,192], SMRL)
- Light orange: Average Gradient (ωᵢ,ᵢ∈[0,96], MRL)
- Orange: Average Gradient (ωⱼ,ⱼ∈[96,192], MRL)
- Blue line: Gradient Variance (ωₖ,ₖ∈[0,192], SMRL)
- Red line: Gradient Variance (ωₖ,ₖ∈[0,192], MRL)
### Detailed Analysis
#### Gradient Size (Bars)
- **Epoch 0**:
- Light blue (ωᵢ,ᵢ∈[0,96], SMRL): 1.198
- Blue (ωⱼ,ⱼ∈[96,192], SMRL): 1.054
- Light orange (ωᵢ,ᵢ∈[0,96], MRL): 3.666
- Orange (ωⱼ,ⱼ∈[96,192], MRL): 1.188
- **Epoch 10**:
- Light blue: 0.063
- Blue: 0.062
- Light orange: 0.184
- Orange: 0.062
- **Epoch 20**:
- Light blue: 0.024
- Blue: 0.026
- Light orange: 0.081
- Orange: 0.025
- **Epoch 30**:
- Light blue: 0.015
- Blue: 0.013
- Light orange: 0.038
- Orange: 0.013
#### Gradient Variance (Lines)
- **SMRL (Blue line)**:
- Epoch 0: 8.84e-8
- Epoch 10: 2.27e-8
- Epoch 20: 1.48e-9
- Epoch 30: 5.78e-10
- **MRL (Red line)**:
- Epoch 0: 3.07e-7
- Epoch 10: 2.27e-8
- Epoch 20: 4.93e-9
- Epoch 30: 1.87e-9
### Key Observations
1. **Gradient Size Trends**:
- All gradient magnitudes decrease over epochs, with MRL consistently showing higher values than SMRL in overlapping ranges.
- The largest gradient magnitudes occur in the [0.96,1.92] range for MRL at epoch 0 (3.666).
- By epoch 30, SMRL gradients stabilize near 0.013, while MRL remains slightly higher at 0.038.
2. **Gradient Variance Trends**:
- Both SMRL and MRL show decreasing variance over epochs.
- MRL starts with significantly higher variance (3.07e-7 at epoch 0) but converges closer to SMRL by epoch 30 (1.87e-9 vs. 5.78e-10).
- SMRL maintains lower variance throughout training.
3. **Notable Patterns**:
- The [0.96,1.92] range (blue/orange bars) dominates gradient magnitudes, suggesting larger parameter updates in later layers.
- Variance lines (blue/red) intersect at epoch 10, indicating similar stability for both methods at this stage.
### Interpretation
The data demonstrates that both SMRL and MRL reduce gradient magnitudes and variance as training progresses, with SMRL achieving faster stabilization. MRL maintains larger gradient magnitudes in the [0.96,1.92] range, potentially indicating stronger updates in later layers but at the cost of higher initial variance. The convergence of variance lines at epoch 10 suggests both methods reach comparable stability thresholds early in training. The logarithmic scales emphasize exponential decay in gradient magnitudes, highlighting the importance of monitoring both size and variance for effective optimization.