## Sequential Multi-Stage Prediction Pipeline Diagram
### Overview
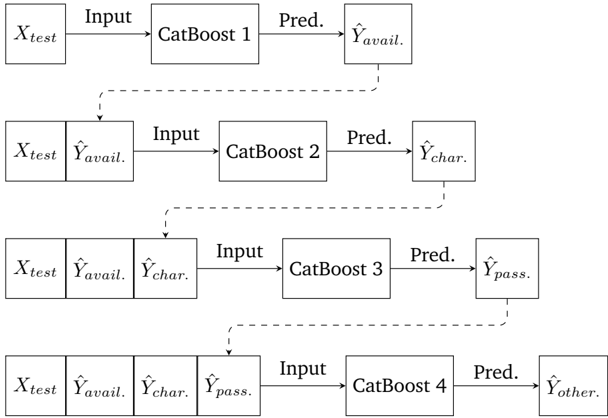
The image displays a technical flowchart illustrating a sequential, multi-stage predictive modeling pipeline. The pipeline consists of four distinct stages, each employing a "CatBoost" model. The process flows from top to bottom, where the output prediction from one stage becomes a critical input feature for the subsequent stage, creating a cascading dependency.
### Components/Axes
The diagram is composed of rectangular boxes representing data or models, connected by arrows indicating data flow. There are two types of arrows:
1. **Solid Arrows:** Indicate the primary input to a CatBoost model and its direct output prediction.
2. **Dashed Arrows:** Indicate that the prediction from a previous stage is fed forward and concatenated with the original test data (`X_test`) to form the input for the next stage.
**Textual Elements (Transcribed):**
* **Data/Input Boxes:**
* `X_test` (Appears in all four stages)
* `Ŷ_avail.` (Prediction from Stage 1)
* `Ŷ_char.` (Prediction from Stage 2)
* `Ŷ_pass.` (Prediction from Stage 3)
* **Model Boxes:**
* `CatBoost 1`
* `CatBoost 2`
* `CatBoost 3`
* `CatBoost 4`
* **Output/Prediction Boxes:**
* `Ŷ_avail.` (Output of CatBoost 1)
* `Ŷ_char.` (Output of CatBoost 2)
* `Ŷ_pass.` (Output of CatBoost 3)
* `Ŷ_other.` (Output of CatBoost 4)
* **Flow Labels:**
* `Input` (Label on solid arrows leading into CatBoost models)
* `Pred.` (Label on solid arrows leading out of CatBoost models)
### Detailed Analysis
The pipeline is structured in four horizontal rows, each representing a stage.
**Stage 1 (Top Row):**
* **Input:** A single box labeled `X_test`.
* **Process:** The `X_test` data is fed (via a solid arrow labeled `Input`) into the model `CatBoost 1`.
* **Output:** `CatBoost 1` produces a prediction labeled `Pred.`, resulting in the output `Ŷ_avail.`.
**Stage 2 (Second Row):**
* **Input:** A composite input formed by concatenating two boxes: `X_test` and `Ŷ_avail.` (the prediction from Stage 1). A dashed arrow visually connects the `Ŷ_avail.` output from Stage 1 to this input block.
* **Process:** This combined input is fed into `CatBoost 2`.
* **Output:** `CatBoost 2` produces the prediction `Ŷ_char.`.
**Stage 3 (Third Row):**
* **Input:** A composite input of three boxes: `X_test`, `Ŷ_avail.`, and `Ŷ_char.`. Dashed arrows connect the outputs from Stages 1 and 2 to this block.
* **Process:** This expanded input is fed into `CatBoost 3`.
* **Output:** `CatBoost 3` produces the prediction `Ŷ_pass.`.
**Stage 4 (Bottom Row):**
* **Input:** A composite input of four boxes: `X_test`, `Ŷ_avail.`, `Ŷ_char.`, and `Ŷ_pass.`. Dashed arrows connect the outputs from all three previous stages.
* **Process:** This final, most comprehensive input is fed into `CatBoost 4`.
* **Output:** `CatBoost 4` produces the final prediction `Ŷ_other.`.
### Key Observations
1. **Sequential Dependency:** The pipeline is strictly sequential. The model in each stage (`CatBoost N`) cannot run until the model in the previous stage (`CatBoost N-1`) has completed and provided its prediction.
2. **Feature Augmentation:** Each stage enriches the feature set for the next model. The input dimensionality grows with each stage: Stage 1 uses only `X_test`, Stage 2 uses `X_test` + 1 prediction, Stage 3 uses `X_test` + 2 predictions, and Stage 4 uses `X_test` + 3 predictions.
3. **Model Consistency:** All four models are of the same type (`CatBoost`), suggesting a consistent algorithmic approach, possibly for comparability or because it is well-suited to the data type (e.g., categorical features).
4. **Prediction Variable Naming:** The predicted variables (`Ŷ`) have descriptive subscripts (`avail.`, `char.`, `pass.`, `other`), indicating they represent different target concepts or tasks (e.g., availability, characteristics, passage, and a residual "other" category).
### Interpretation
This diagram represents a **cascaded or stacked generalization (stacking) pipeline** for multi-task learning or a complex prediction problem broken into sequential sub-problems.
* **What it demonstrates:** The architecture suggests that the final prediction target (`Ŷ_other.`) is complex and benefits from being predicted *after* a series of intermediate, related predictions (`Ŷ_avail.`, `Ŷ_char.`, `Ŷ_pass.`). The model for `Ŷ_other.` leverages not just the raw features (`X_test`) but also the learned representations from the intermediate tasks.
* **Relationship between elements:** The dashed arrows are the most critical component. They define the core logic: each model's prediction is treated as a new, potentially informative feature for all subsequent models. This creates a hierarchy of learned information.
* **Potential rationale:** This structure could be used when:
1. The intermediate predictions (`avail.`, `char.`, `pass.`) are themselves valuable outputs.
2. These intermediate tasks are easier or provide a useful inductive bias for the final, harder task (`other`).
3. The goal is to explicitly model the dependency between these related targets, rather than predicting them all independently.
* **Notable Anomaly/Consideration:** The pipeline's performance is highly sensitive to the order of the stages. If `Ŷ_pass.` is a poor predictor, its errors will propagate and potentially degrade the performance of `CatBoost 4`. The design implies the creators have determined this specific order (`avail.` -> `char.` -> `pass.` -> `other`) is optimal.