## Flowchart: Sequential CatBoost Prediction Pipeline
### Overview
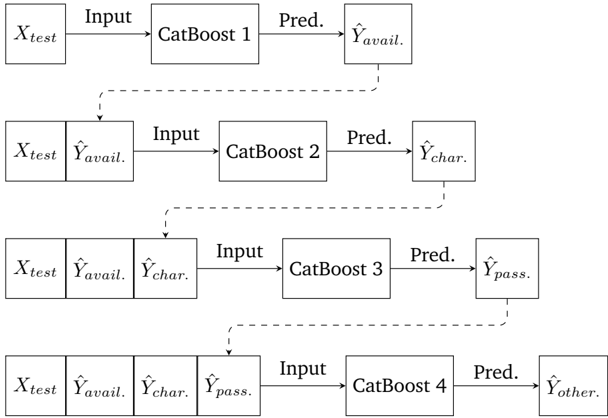
The diagram illustrates a multi-stage prediction pipeline using CatBoost models. Each stage processes inputs (original data and prior predictions) to generate refined predictions, culminating in a final composite output. The flow is sequential, with optional feedback loops indicated by dashed lines.
### Components/Axes
- **Inputs**:
- `X_test`: Original test data (appears in all stages).
- `Ŷ_avail.`: Availability prediction (output of CatBoost 1, input to CatBoost 2).
- `Ŷ_char.`: Characteristic prediction (output of CatBoost 2, input to CatBoost 3).
- `Ŷ_pass.`: Pass-through prediction (output of CatBoost 3, input to CatBoost 4).
- **Models**:
- **CatBoost 1**: Input = `X_test` → Output = `Ŷ_avail.`.
- **CatBoost 2**: Input = `X_test` + `Ŷ_avail.` → Output = `Ŷ_char.`.
- **CatBoost 3**: Input = `X_test` + `Ŷ_avail.` + `Ŷ_char.` → Output = `Ŷ_pass.`.
- **CatBoost 4**: Input = `X_test` + `Ŷ_avail.` + `Ŷ_char.` + `Ŷ_pass.` → Output = `Ŷ_other.`.
- **Flow**:
- Solid arrows indicate mandatory data flow.
- Dashed arrows suggest optional feedback or iterative refinement.
### Detailed Analysis
1. **Stage 1 (CatBoost 1)**:
- Processes raw data (`X_test`) to predict availability (`Ŷ_avail.`).
- No prior predictions used.
2. **Stage 2 (CatBoost 2)**:
- Combines raw data (`X_test`) with availability prediction (`Ŷ_avail.`) to refine characteristic prediction (`Ŷ_char.`).
3. **Stage 3 (CatBoost 3)**:
- Integrates raw data, availability, and characteristic predictions to generate a pass-through prediction (`Ŷ_pass.`).
4. **Stage 4 (CatBoost 4)**:
- Final stage merges all prior predictions (`X_test`, `Ŷ_avail.`, `Ŷ_char.`, `Ŷ_pass.`) to produce the composite output (`Ŷ_other.`).
### Key Observations
- **Hierarchical Dependency**: Each stage relies on outputs from prior models, suggesting a cascading refinement process.
- **Feedback Mechanism**: Dashed lines imply potential iterative adjustments (e.g., reprocessing `X_test` with updated predictions).
- **Composite Output**: The final prediction (`Ŷ_other.`) aggregates insights from all stages, likely improving robustness.
### Interpretation
This pipeline demonstrates an ensemble-like approach where sequential CatBoost models iteratively enhance predictions. By incorporating prior outputs as inputs, later stages correct or refine earlier errors, mimicking a feedback-driven optimization. The use of `X_test` in all stages ensures the original data remains central, while incremental predictions (`Ŷ_avail.`, `Ŷ_char.`, etc.) act as intermediate features. The final output (`Ŷ_other.`) likely represents a synergistic combination of all stages, potentially reducing bias or variance compared to standalone models.
**Note**: No numerical values or explicit trends are present in the diagram; it focuses on architectural relationships rather than quantitative performance metrics.