## Heatmap: Accuracy Difference between BO and GCN
### Overview
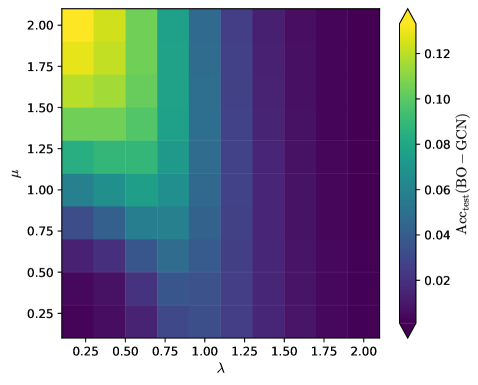
The image is a heatmap visualizing the difference in test accuracy (Acc_test) between Bayesian Optimization (BO) and Graph Convolutional Networks (GCN) across different values of parameters lambda (λ) and mu (μ). The color intensity represents the magnitude of the accuracy difference, with yellow indicating higher accuracy for BO compared to GCN, and dark purple indicating lower accuracy.
### Components/Axes
* **X-axis (Horizontal):** λ (lambda), ranging from 0.25 to 2.00 in increments of 0.25.
* **Y-axis (Vertical):** μ (mu), ranging from 0.25 to 2.00 in increments of 0.25.
* **Colorbar (Right):** Represents Acc_test (BO - GCN), ranging from approximately 0.00 (dark purple) to 0.12 (yellow).
### Detailed Analysis
The heatmap consists of a grid of colored cells, where each cell represents a combination of λ and μ values. The color of each cell indicates the difference in test accuracy between BO and GCN for that specific parameter combination.
Here's a breakdown of the data based on visual inspection:
* **Trend:** The top-left region of the heatmap (low λ, high μ) shows the highest accuracy difference (yellow), indicating that BO performs significantly better than GCN in this parameter range. As we move towards the bottom-right (high λ, low μ), the color shifts towards dark purple, indicating that the accuracy difference decreases, and GCN may perform comparably or better than BO.
* **Specific Values (Approximate):**
* λ = 0.25, μ = 2.00: Acc_test (BO - GCN) ≈ 0.12 (Yellow)
* λ = 0.25, μ = 1.75: Acc_test (BO - GCN) ≈ 0.11 (Yellow-Green)
* λ = 0.50, μ = 2.00: Acc_test (BO - GCN) ≈ 0.10 (Yellow-Green)
* λ = 0.25, μ = 1.50: Acc_test (BO - GCN) ≈ 0.09 (Green)
* λ = 2.00, μ = 0.25: Acc_test (BO - GCN) ≈ 0.00 (Dark Purple)
* λ = 1.75, μ = 0.25: Acc_test (BO - GCN) ≈ 0.01 (Dark Purple)
### Key Observations
* The largest positive difference in accuracy (BO > GCN) occurs when λ is low (0.25-0.50) and μ is high (1.75-2.00).
* The accuracy difference decreases as λ increases and μ decreases.
* The smallest difference in accuracy (BO ≈ GCN or BO < GCN) occurs when λ is high (1.75-2.00) and μ is low (0.25-0.50).
### Interpretation
The heatmap suggests that the relative performance of Bayesian Optimization (BO) compared to Graph Convolutional Networks (GCN) is highly dependent on the values of parameters λ and μ. Specifically, BO tends to outperform GCN when λ is small and μ is large. This could indicate that BO is better suited for certain types of optimization problems or network architectures characterized by these parameter ranges. Conversely, GCN may be more effective when λ is large and μ is small. The choice between BO and GCN should therefore consider the specific characteristics of the problem and the desired parameter settings.