\n
## Heatmap: BO - GCN Accuracy
### Overview
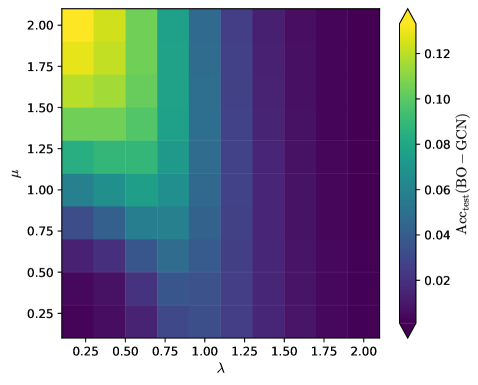
The image presents a heatmap visualizing the relationship between two parameters, λ (lambda) and μ (mu), and their impact on the test accuracy (Acc_test) of a Bayesian Optimization - Graph Convolutional Network (BO-GCN) model. The heatmap displays a color gradient representing the accuracy values, ranging from approximately 0.02 (dark purple) to 0.12 (bright yellow).
### Components/Axes
* **X-axis:** λ (lambda) - ranges from 0.25 to 2.00, with increments of approximately 0.25.
* **Y-axis:** μ (mu) - ranges from 0.25 to 2.00, with increments of approximately 0.25.
* **Color Scale (Legend):** Located on the right side of the heatmap, the color scale represents the Acc_test (BO - GCN) values.
* Yellow: ~0.12
* Light Green: ~0.10
* Green: ~0.08
* Light Blue: ~0.06
* Blue: ~0.04
* Dark Purple: ~0.02
### Detailed Analysis
The heatmap is a 9x9 grid, representing combinations of λ and μ values. The color intensity at each grid point corresponds to the Acc_test value for that specific combination.
Here's a breakdown of approximate Acc_test values based on the color gradient:
* **λ = 0.25:**
* μ = 0.25: ~0.02
* μ = 0.50: ~0.04
* μ = 0.75: ~0.06
* μ = 1.00: ~0.08
* μ = 1.25: ~0.08
* μ = 1.50: ~0.06
* μ = 1.75: ~0.04
* μ = 2.00: ~0.02
* **λ = 0.50:**
* μ = 0.25: ~0.04
* μ = 0.50: ~0.06
* μ = 0.75: ~0.08
* μ = 1.00: ~0.10
* μ = 1.25: ~0.10
* μ = 1.50: ~0.08
* μ = 1.75: ~0.06
* μ = 2.00: ~0.04
* **λ = 0.75:**
* μ = 0.25: ~0.06
* μ = 0.50: ~0.08
* μ = 0.75: ~0.10
* μ = 1.00: ~0.12
* μ = 1.25: ~0.10
* μ = 1.50: ~0.08
* μ = 1.75: ~0.06
* μ = 2.00: ~0.04
* **λ = 1.00:**
* μ = 0.25: ~0.08
* μ = 0.50: ~0.10
* μ = 0.75: ~0.12
* μ = 1.00: ~0.12
* μ = 1.25: ~0.10
* μ = 1.50: ~0.08
* μ = 1.75: ~0.06
* μ = 2.00: ~0.04
* **λ = 1.25:**
* μ = 0.25: ~0.08
* μ = 0.50: ~0.10
* μ = 0.75: ~0.10
* μ = 1.00: ~0.08
* μ = 1.25: ~0.06
* μ = 1.50: ~0.04
* μ = 1.75: ~0.02
* μ = 2.00: ~0.02
* **λ = 1.50:**
* μ = 0.25: ~0.06
* μ = 0.50: ~0.08
* μ = 0.75: ~0.10
* μ = 1.00: ~0.08
* μ = 1.25: ~0.06
* μ = 1.50: ~0.04
* μ = 1.75: ~0.02
* μ = 2.00: ~0.02
* **λ = 1.75:**
* μ = 0.25: ~0.04
* μ = 0.50: ~0.06
* μ = 0.75: ~0.08
* μ = 1.00: ~0.06
* μ = 1.25: ~0.04
* μ = 1.50: ~0.02
* μ = 1.75: ~0.02
* μ = 2.00: ~0.02
* **λ = 2.00:**
* μ = 0.25: ~0.02
* μ = 0.50: ~0.04
* μ = 0.75: ~0.06
* μ = 1.00: ~0.04
* μ = 1.25: ~0.02
* μ = 1.50: ~0.02
* μ = 1.75: ~0.02
* μ = 2.00: ~0.02
### Key Observations
* The highest accuracy values (around 0.12) are concentrated in the region where both λ and μ are around 0.75 to 1.00.
* Accuracy generally decreases as λ and μ move away from this optimal region, towards lower or higher values.
* There's a noticeable diagonal pattern, suggesting a correlation between λ and μ in influencing the accuracy.
* The bottom-left and top-right corners of the heatmap consistently show the lowest accuracy values (around 0.02).
### Interpretation
The heatmap demonstrates the impact of the hyperparameters λ and μ on the performance of the BO-GCN model. The optimal combination of these parameters appears to be around λ = 0.75-1.00 and μ = 0.75-1.00, where the model achieves the highest test accuracy. The decrease in accuracy as these parameters deviate from the optimal range suggests that these values are crucial for the model's ability to effectively learn and generalize. The diagonal pattern indicates that the interplay between λ and μ is important; increasing one parameter may require adjusting the other to maintain optimal performance. The heatmap provides valuable insights for hyperparameter tuning, guiding the selection of λ and μ values to maximize the model's accuracy. The data suggests a non-linear relationship between the parameters and the accuracy, as the highest accuracy is not achieved at the maximum values of either parameter.