\n
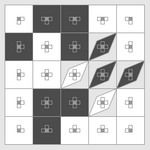
## Diagram: Grid of Cells with Symbols
### Overview
The image presents a 5x5 grid of cells. Each cell contains a symbol resembling a plus sign with rounded ends, and is filled with one of three shades of gray: white, light gray, or dark gray. Additionally, some cells contain a rotated diamond shape, also in varying shades of gray. The arrangement appears to be patterned, but lacks explicit labels or axes.
### Components/Axes
There are no explicit axes or labels. The components are:
* **Grid:** A 5x5 arrangement of cells.
* **Plus Sign Symbol:** Present in every cell.
* **Diamond Shape:** Present in some cells, rotated approximately 45 degrees.
* **Color/Shading:** Three shades of gray: white, light gray, and dark gray.
### Detailed Analysis or Content Details
The grid can be described cell by cell, starting from the top-left:
* **Row 1:** White, Dark Gray, Dark Gray, Light Gray, Light Gray
* **Row 2:** Light Gray, White, Light Gray, Dark Gray with Diamond (Light Gray), Light Gray
* **Row 3:** White, Light Gray, White, Dark Gray with Diamond (Dark Gray), Dark Gray with Diamond (Light Gray)
* **Row 4:** Light Gray, White, Light Gray with Diamond (Light Gray), White, Light Gray
* **Row 5:** Dark Gray, White, Dark Gray, White, White
The diamond shapes are present in the following cells:
* Row 2, Column 4: Light Gray Diamond
* Row 3, Column 4: Dark Gray Diamond
* Row 3, Column 5: Light Gray Diamond
* Row 4, Column 3: Light Gray Diamond
### Key Observations
* The pattern is not strictly symmetrical, but exhibits a degree of repetition.
* The dark gray cells tend to cluster towards the left and bottom of the grid.
* The diamond shapes are not randomly distributed; they appear in a diagonal pattern.
* The presence of the diamond shape seems to correlate with the cell's shading.
### Interpretation
This diagram appears to be a visual representation of a matrix or a state space. The different shades of gray could represent different values or categories, and the diamond shapes might indicate a specific condition or event. The arrangement suggests a possible relationship between the cell's state (gray level) and the presence or absence of the diamond.
Without further context, it's difficult to determine the exact meaning of the diagram. It could represent:
* **A cellular automaton:** Where the state of each cell evolves based on the states of its neighbors.
* **A game board:** Where the different shades represent different terrain types or player positions.
* **A data visualization:** Where the grid represents a dataset, and the shades represent different values.
* **A logical map:** Where the cells represent states and the diamonds represent transitions.
The diagonal pattern of the diamonds suggests a directional influence or a flow of information. The clustering of dark gray cells could indicate areas of high concentration or activity.
The diagram is abstract and requires additional information to fully understand its purpose and meaning. It is a visual pattern, but lacks explicit data or labels to provide a definitive interpretation.