## Diagram: Meta-Learning and Adaptation Process
### Overview
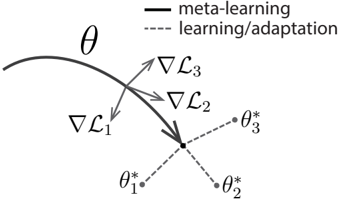
The diagram illustrates the relationship between meta-learning (represented by a solid curve) and task-specific learning/adaptation (represented by dashed lines). Gradients (∇L₁, ∇L₂, ∇L₃) indicate optimization directions toward distinct parameter sets (θ*₁, θ*₂, θ*₃), suggesting a hierarchical optimization framework.
### Components/Axes
- **Main Curve (θ)**: Solid black line labeled "meta-learning," curving from left to right.
- **Dashed Lines**: Labeled "learning/adaptation," branching from a central point toward θ*₁, θ*₂, and θ*₃.
- **Gradients**:
- ∇L₁: Points toward θ*₁.
- ∇L₂: Points toward θ*₂.
- ∇L₃: Points toward θ*₃.
- **Legend**: Located in the top-right corner, distinguishing solid (meta-learning) and dashed (learning/adaptation) lines.
- **Parameter Points**: θ*₁, θ*₂, θ*₃ (marked with dots) at the endpoints of dashed lines.
### Detailed Analysis
- **Meta-Learning Curve (θ)**: The solid curve represents the overarching meta-learning process, which guides the adaptation paths. Its curvature suggests dynamic adjustment of hyperparameters or shared knowledge across tasks.
- **Learning/Adaptation Paths**: Dashed lines originate from a central node (likely the meta-learner’s output) and diverge toward task-specific optima (θ*₁, θ*₂, θ*₃). This implies task-specific fine-tuning guided by meta-learned strategies.
- **Gradients**: Arrows labeled ∇L₁, ∇L₂, ∇L₃ indicate the direction of parameter updates for each task. Their alignment with θ* points suggests that meta-learning optimizes the adaptation process to minimize task-specific losses (L₁, L₂, L₃).
### Key Observations
1. **Central Node**: The convergence point of dashed lines implies a shared meta-learner that initializes or constrains task-specific adaptations.
2. **Gradient Alignment**: Gradients directly point to θ* points, indicating that meta-learning explicitly shapes the optimization landscape for adaptation.
3. **Task-Specificity**: Each θ* point represents a distinct task or dataset, with adaptation paths tailored to minimize corresponding losses.
### Interpretation
This diagram models a meta-learning framework where a central learner (θ) optimizes the adaptation process across multiple tasks. The gradients (∇L₁–∇L₃) suggest that meta-learning adjusts the adaptation mechanism to efficiently reach task-specific optima (θ*₁–θ*₃). The absence of numerical values implies a conceptual representation rather than empirical data, emphasizing the hierarchical relationship between meta-learning and task adaptation. The structure aligns with meta-learning paradigms where a model learns to "learn" by optimizing adaptation strategies, enabling rapid generalization to new tasks.