## Diagram: MAX Unit and MUX Network
### Overview
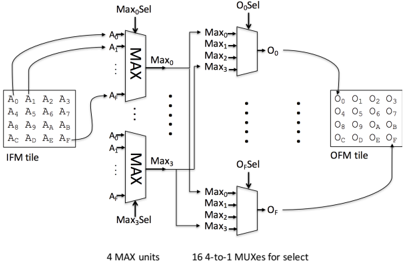
The image depicts a diagram of a system involving MAX units and multiplexers (MUXes) for selection, likely in a hardware or computational context. It shows data flow from an Input Feature Map (IFM) tile through MAX units to a network of MUXes, and finally to an Output Feature Map (OFM) tile.
### Components/Axes
* **IFM tile:** A 4x4 grid labeled with `A0` to `AF`. This represents the input data.
* **MAX Units:** Four MAX units are shown, each taking multiple inputs (`A0` to `AF`) from the IFM tile and producing a single output (`Max0` to `Max3`). Each MAX unit has a selection input labeled `Max_i Sel`, where `i` is the index of the MAX unit (0 to 3).
* **16 4-to-1 MUXes:** A network of 16 multiplexers, each selecting one of four inputs (`Max0` to `Max3`). Each MUX has a selection input labeled `O_i Sel`, where `i` is the index of the MUX (0 to F).
* **OFM tile:** A 4x4 grid labeled with `O0` to `OF`. This represents the output data.
### Detailed Analysis
* **IFM Tile:** The IFM tile is a 4x4 grid with elements labeled `A0`, `A1`, `A2`, `A3`, `A4`, `A5`, `A6`, `A7`, `A8`, `A9`, `AA`, `AB`, `AC`, `AD`, `AE`, `AF`.
* **MAX Units:**
* The first MAX unit takes inputs `A0` and `A1` from the IFM tile.
* The last MAX unit takes input `AF` from the IFM tile.
* The outputs of the MAX units are labeled `Max0`, `Max1`, `Max2`, and `Max3`.
* **MUX Network:**
* Each MUX takes `Max0`, `Max1`, `Max2`, and `Max3` as inputs.
* The outputs of the MUXes are labeled `O0` to `OF`.
* **OFM Tile:** The OFM tile is a 4x4 grid with elements labeled `O0`, `O1`, `O2`, `O3`, `O4`, `O5`, `O6`, `O7`, `O8`, `O9`, `OA`, `OB`, `OC`, `OD`, `OE`, `OF`.
* **Connections:** The output `O0` of the first MUX is connected to the `O0` element of the OFM tile. The output `OF` of the last MUX is connected to the `OF` element of the OFM tile.
### Key Observations
* The IFM tile provides input to the MAX units.
* The MAX units perform a maximum operation on their inputs.
* The outputs of the MAX units are fed into the MUX network.
* The MUX network selects one of the MAX unit outputs for each output element.
* The outputs of the MUX network form the OFM tile.
### Interpretation
The diagram illustrates a system for feature extraction and selection. The IFM tile represents the input features. The MAX units likely perform a max-pooling operation, selecting the maximum value from a set of input features. The MUX network then selects specific max-pooled features to form the OFM tile, which represents the output features. The `Max_i Sel` and `O_i Sel` signals control the selection process, allowing for different feature combinations to be chosen. This architecture could be used in convolutional neural networks or other machine learning models for feature extraction and dimensionality reduction.