\n
## Diagram: Max Pooling Architecture
### Overview
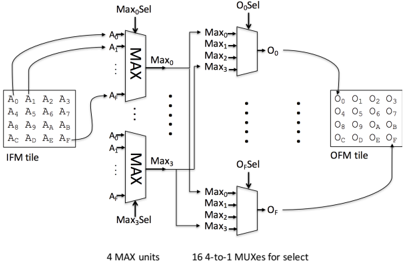
The image depicts a diagram of a max pooling architecture, likely within a convolutional neural network. It illustrates the flow of data from an Input Feature Map (IFM) tile through max pooling units to an Output Feature Map (OFM) tile. The diagram highlights the selection process within the max pooling units and the subsequent multiplexing to generate the output.
### Components/Axes
The diagram consists of the following key components:
* **IFM Tile:** Labeled "IFM tile", this represents the input feature map. It contains elements labeled A₀ through A₉, arranged in a 3x4 grid.
* **MAX Units:** Two "MAX" blocks are shown, representing the max pooling operation. Each MAX unit receives multiple inputs (A₀-A₉).
* **Max₀Sel & Max₁Sel:** Selection signals for the first and second MAX units, respectively.
* **Max₀, Max₁, Max₂, Max₃:** Outputs from the first MAX unit.
* **Max₀, Max₁, Max₂, Max₃:** Outputs from the second MAX unit.
* **O₀Sel & O₁Sel:** Selection signals for the output multiplexers.
* **O₀ & Oғ:** Outputs from the output multiplexers.
* **OFM Tile:** Labeled "OFM tile", this represents the output feature map. It contains elements labeled O₀ through O₉, arranged in a 3x4 grid.
* **Annotation:** "4 MAX units" and "16 4-to-1 MUXes for select" are present, providing information about the number of units used.
* **Arrows:** Curved arrows indicate the data flow between the IFM tile, MAX units, multiplexers, and OFM tile.
### Detailed Analysis or Content Details
The diagram shows a 2x2 max pooling operation repeated across the IFM tile.
* **IFM Tile:** The input tile contains 12 elements (A₀ to A₉).
* **MAX Units:** Each MAX unit receives four inputs (A₀-A₃ for the first, A₄-A₉ for the second). The MAX unit selects the maximum value from these four inputs.
* **Multiplexers:** The outputs of the MAX units (Max₀-Max₃) are fed into multiplexers. The multiplexers select one of the four maximum values based on the selection signal (O₀Sel or O₁Sel).
* **OFM Tile:** The output tile contains 12 elements (O₀ to O₉). Each output element is the result of a max pooling operation on a 2x2 region of the input tile.
* **Data Flow:** The curved arrows indicate that the output of the multiplexers is written to the corresponding location in the OFM tile.
### Key Observations
* The diagram illustrates a simplified max pooling architecture.
* The use of multiplexers allows for flexible selection of the maximum value.
* The diagram suggests a parallel processing scheme, with multiple MAX units operating simultaneously.
* The annotation indicates that 16 4-to-1 multiplexers are used for selection.
### Interpretation
The diagram demonstrates the core principle of max pooling: reducing the spatial dimensions of the input feature map while retaining the most important features (represented by the maximum values). This process helps to reduce computational complexity and improve the robustness of the model to variations in the input. The multiplexers provide a mechanism for selecting the appropriate maximum value based on the desired pooling strategy. The diagram highlights the parallel nature of the max pooling operation, which is crucial for efficient processing of large feature maps. The annotation about the number of MAX units and multiplexers provides insight into the hardware implementation of the max pooling layer. The diagram is a conceptual representation and does not specify the exact details of the implementation, such as the size of the input and output feature maps or the specific selection criteria for the multiplexers.