# Technical Document Extraction: Chart Analysis
## Chart 1: L2 Error Squared vs. Step
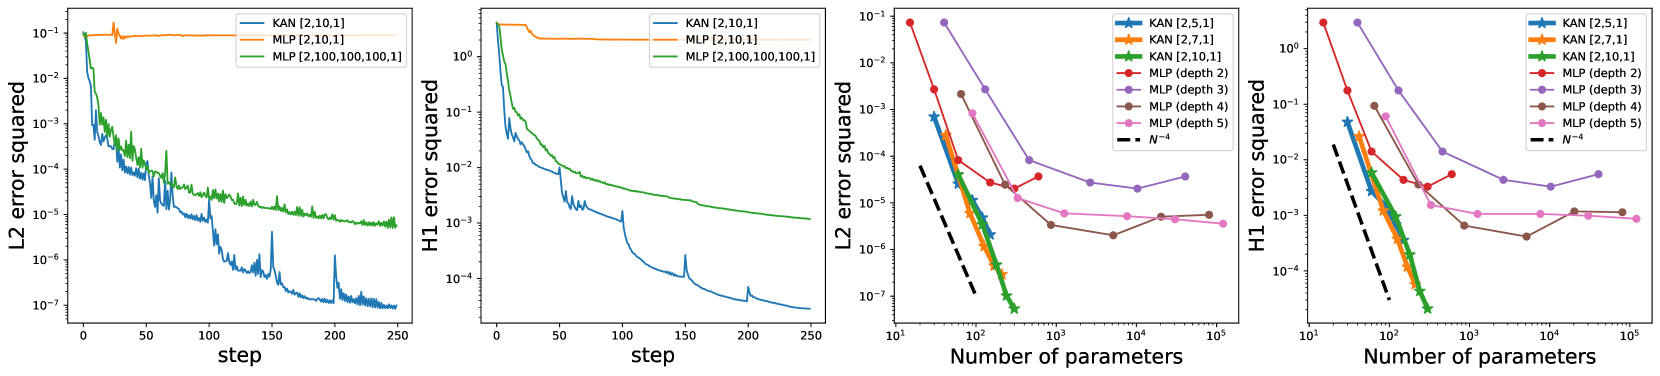
- **X-axis**: `step` (0 to 250)
- **Y-axis**: `L2 error squared` (10⁻¹ to 10⁻⁷)
- **Legend**:
- `KAN [2,10,1]` (blue line)
- `MLP [2,10,1]` (orange line)
- `MLP [2,100,100,100,1]` (green line)
- **Key Trends**:
- `KAN [2,10,1]` starts at ~10⁻¹, drops sharply to ~10⁻⁷ by step 250.
- `MLP [2,10,1]` remains flat at ~10⁻¹.
- `MLP [2,100,100,100,1]` starts at ~10⁻¹, drops to ~10⁻⁵ by step 50, then stabilizes.
## Chart 2: H1 Error Squared vs. Step
- **X-axis**: `step` (0 to 250)
- **Y-axis**: `H1 error squared` (10⁰ to 10⁻⁴)
- **Legend**:
- `KAN [2,10,1]` (blue line)
- `MLP [2,10,1]` (orange line)
- `MLP [2,100,100,100,1]` (green line)
- **Key Trends**:
- `KAN [2,10,1]` starts at ~10⁰, drops to ~10⁻⁴ by step 250.
- `MLP [2,10,1]` remains flat at ~10⁰.
- `MLP [2,100,100,100,1]` starts at ~10⁰, drops to ~10⁻³ by step 50, then stabilizes.
## Chart 3: L2 Error Squared vs. Number of Parameters
- **X-axis**: `Number of parameters` (log scale: 10¹ to 10⁵)
- **Y-axis**: `L2 error squared` (10⁰ to 10⁻⁷)
- **Legend**:
- `KAN [2,5,1]` (blue line)
- `KAN [2,7,1]` (orange line)
- `KAN [2,10,1]` (green line)
- `MLP (depth 2)` (red line)
- `MLP (depth 3)` (purple line)
- `MLP (depth 4)` (brown line)
- `MLP (depth 5)` (pink line)
- `N⁻⁴` (dashed black line)
- **Key Trends**:
- `KAN` lines (blue, orange, green) show steep declines, outperforming `MLP` lines.
- `MLP (depth 5)` (pink) and `MLP (depth 4)` (brown) lines are closest to `N⁻⁴`.
- `KAN [2,10,1]` (green) intersects `N⁻⁴` at ~10³ parameters.
## Chart 4: H1 Error Squared vs. Number of Parameters
- **X-axis**: `Number of parameters` (log scale: 10¹ to 10⁵)
- **Y-axis**: `H1 error squared` (10⁰ to 10⁻³)
- **Legend**:
- `KAN [2,5,1]` (blue line)
- `KAN [2,7,1]` (orange line)
- `KAN [2,10,1]` (green line)
- `MLP (depth 2)` (red line)
- `MLP (depth 3)` (purple line)
- `MLP (depth 4)` (brown line)
- `MLP (depth 5)` (pink line)
- `N⁻⁴` (dashed black line)
- **Key Trends**:
- `KAN` lines (blue, orange, green) show steep declines, outperforming `MLP` lines.
- `MLP (depth 5)` (pink) and `MLP (depth 4)` (brown) lines are closest to `N⁻⁴`.
- `KAN [2,10,1]` (green) intersects `N⁻⁴` at ~10³ parameters.
## Cross-Reference Validation
- **Legend Colors/Labels**:
- All `KAN` lines (blue, orange, green) match their respective datasets across charts.
- `MLP` lines (red, purple, brown, pink) consistently represent their depth configurations.
- `N⁻⁴` (dashed black) is present in Charts 3 and 4 as a reference baseline.
- **Consistency Checks**:
- `KAN [2,10,1]` (green) appears in Charts 1, 3, and 4 with identical trends.
- `MLP [2,100,100,100,1]` (green) in Charts 1 and 2 aligns with `MLP (depth 5)` (pink) in Charts 3 and 4.