## Line Chart: Average Liar Score vs. Layer Index
### Overview
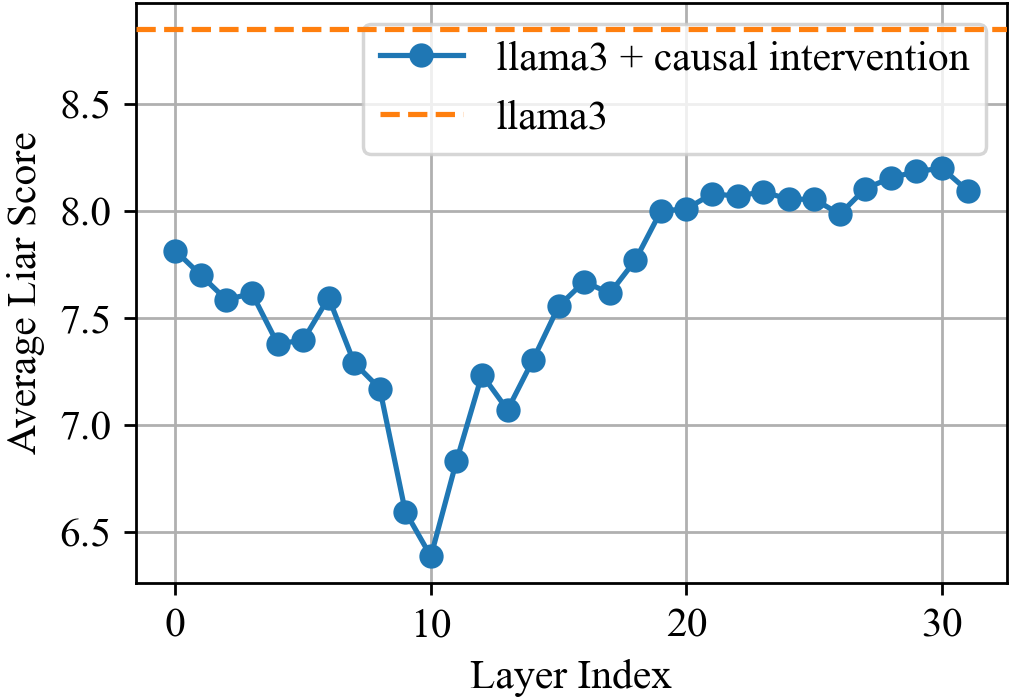
The image is a line chart comparing the "Average Liar Score" of two models: "llama3 + causal intervention" and "llama3" across different "Layer Index" values. The x-axis represents the Layer Index, ranging from 0 to 30. The y-axis represents the Average Liar Score, ranging from 6.5 to 8.5. The chart displays the performance of the two models, with "llama3 + causal intervention" showing a fluctuating trend and "llama3" showing a constant value.
### Components/Axes
* **X-axis:** Layer Index, ranging from 0 to 30 in increments of 10.
* **Y-axis:** Average Liar Score, ranging from 6.5 to 8.5 in increments of 0.5.
* **Legend:** Located at the top-right of the chart.
* Blue line with circle markers: "llama3 + causal intervention"
* Orange dashed line: "llama3"
### Detailed Analysis
* **llama3 + causal intervention (Blue Line):**
* The line starts at approximately (0, 7.8).
* It decreases to a minimum around (10, 6.4).
* Then, it increases to a plateau around (20, 8.0).
* Finally, it fluctuates slightly around 8.1 between layer index 20 and 30.
* Specific data points:
* (0, 7.8)
* (2, 7.7)
* (4, 7.6)
* (6, 7.4)
* (8, 7.3)
* (10, 6.4)
* (12, 6.9)
* (14, 7.2)
* (16, 7.6)
* (18, 7.7)
* (20, 8.0)
* (22, 8.1)
* (24, 8.1)
* (26, 8.1)
* (28, 8.0)
* (30, 8.2)
* (32, 8.1)
* **llama3 (Orange Dashed Line):**
* The line is constant across all layer indices.
* The Average Liar Score is approximately 8.8.
### Key Observations
* The "llama3" model has a constant Average Liar Score across all layers.
* The "llama3 + causal intervention" model's Average Liar Score fluctuates significantly, with a notable dip around layer index 10.
* The "llama3 + causal intervention" model's performance improves significantly after layer index 10, eventually reaching a plateau close to the "llama3" model's score.
### Interpretation
The chart suggests that causal intervention in the "llama3" model initially reduces the Average Liar Score, indicating a potential decrease in undesirable behavior. However, as the layer index increases, the model recovers and eventually performs comparably to the original "llama3" model. The dip around layer index 10 could indicate a critical point where the intervention has the most significant impact. The constant performance of the "llama3" model serves as a baseline for comparison.