# Technical Data Extraction: Model Performance Analysis
## 1. Image Overview
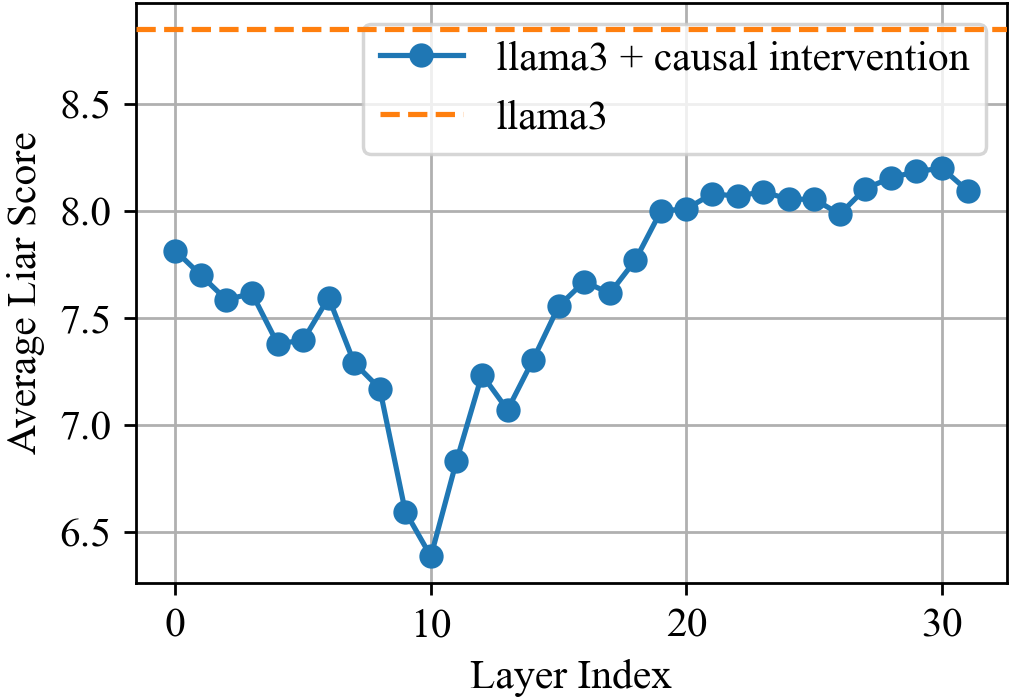
This image is a line graph comparing the performance of two versions of the "llama3" large language model across different neural network layers. It measures a metric called "Average Liar Score" against the "Layer Index."
## 2. Component Isolation
### Header/Legend
* **Location:** Top right quadrant of the chart area.
* **Legend Item 1:** Blue solid line with circular markers labeled "**llama3 + causal intervention**".
* **Legend Item 2:** Orange dashed line labeled "**llama3**".
### Axis Definitions
* **Y-Axis (Vertical):**
* **Label:** Average Liar Score
* **Scale:** 6.5 to 8.5 (with major tick marks every 0.5 units).
* **X-Axis (Horizontal):**
* **Label:** Layer Index
* **Scale:** 0 to 30 (with major tick marks every 10 units). There are 32 distinct data points visible for the intervention series (indices 0 through 31).
## 3. Data Series Analysis
### Series 1: llama3 (Baseline)
* **Visual Trend:** A horizontal, static orange dashed line.
* **Value:** Constant at approximately **8.85** (positioned above the 8.5 grid line).
* **Interpretation:** This represents the baseline performance of the standard llama3 model, which remains constant regardless of the layer index in this specific comparison context.
### Series 2: llama3 + causal intervention
* **Visual Trend:**
1. **Initial Decline:** Starts at ~7.8 (Layer 0) and trends downward with minor fluctuations.
2. **Sharp Drop:** A significant plunge occurs between Layer 8 and Layer 10.
3. **Global Minimum:** Reaches its lowest point at Layer 10.
4. **Recovery:** Sharp ascent from Layer 10 to Layer 13, followed by a steady upward trend.
5. **Plateau:** Stabilizes between Layer 20 and Layer 31, fluctuating slightly around the 8.0 - 8.2 range, but remaining consistently below the baseline llama3 score.
#### Key Data Points (Estimated)
| Layer Index | Estimated Average Liar Score |
| :--- | :--- |
| 0 | ~7.8 |
| 5 | ~7.4 |
| 10 (Minimum) | ~6.4 |
| 15 | ~7.55 |
| 20 | ~8.0 |
| 30 | ~8.2 |
| 31 | ~8.1 |
## 4. Summary of Findings
The "causal intervention" significantly reduces the "Average Liar Score" across all 32 layers compared to the baseline llama3 model. The intervention is most effective at **Layer 10**, where the score drops by approximately 2.45 points (from ~8.85 to ~6.4). While the score recovers in later layers, it never returns to the baseline level, suggesting the intervention has a persistent, though varying, effect throughout the model's architecture.