\n
## Line Chart: Average Liar Score vs. Layer Index
### Overview
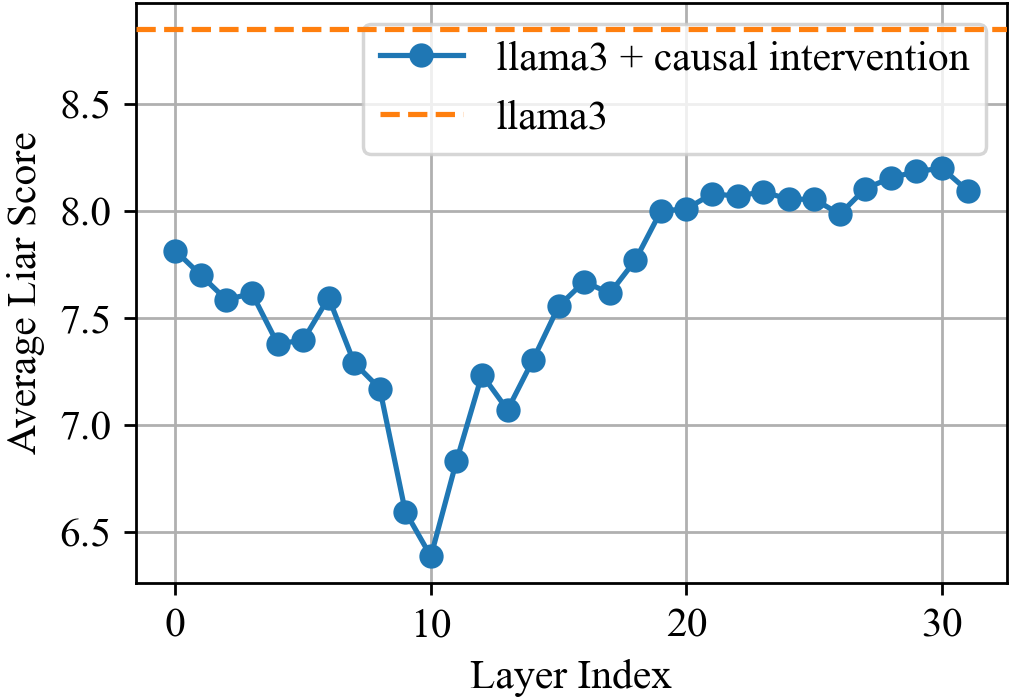
This line chart compares the "Average Liar Score" of two models, "llama3" and "llama3 + causal intervention", across different "Layer Index" values. The chart displays how the average liar score changes as the layer index increases.
### Components/Axes
* **X-axis:** "Layer Index" - Ranges from approximately 0 to 32.
* **Y-axis:** "Average Liar Score" - Ranges from approximately 6.4 to 8.6.
* **Data Series 1:** "llama3 + causal intervention" - Represented by a solid blue line with circular markers.
* **Data Series 2:** "llama3" - Represented by a dashed orange line.
* **Legend:** Located in the top-right corner of the chart.
### Detailed Analysis
**Data Series 1: "llama3 + causal intervention"**
The blue line shows a decreasing trend from Layer Index 0 to approximately Layer Index 9, then a sharp increase, followed by a plateau.
* At Layer Index 0, the Average Liar Score is approximately 7.7.
* At Layer Index 4, the Average Liar Score is approximately 7.6.
* At Layer Index 8, the Average Liar Score is approximately 7.4.
* At Layer Index 9, the Average Liar Score reaches a minimum of approximately 6.4.
* At Layer Index 12, the Average Liar Score is approximately 7.2.
* At Layer Index 16, the Average Liar Score is approximately 7.6.
* At Layer Index 20, the Average Liar Score is approximately 8.0.
* At Layer Index 24, the Average Liar Score is approximately 8.1.
* At Layer Index 30, the Average Liar Score is approximately 8.2.
**Data Series 2: "llama3"**
The orange dashed line is relatively flat across all Layer Index values.
* The Average Liar Score remains consistently around 8.3 throughout the entire range of Layer Index values (0 to 32).
### Key Observations
* The "llama3 + causal intervention" model exhibits a significant change in Average Liar Score as the Layer Index increases, while the "llama3" model remains stable.
* The "llama3 + causal intervention" model initially has a higher Average Liar Score than the "llama3" model, but the score decreases significantly before increasing again.
* The "llama3 + causal intervention" model eventually surpasses the "llama3" model in Average Liar Score at approximately Layer Index 20.
### Interpretation
The data suggests that the causal intervention applied to the "llama3" model has a notable impact on its Average Liar Score, particularly as the layer index increases. The initial decrease in the score could indicate that the intervention is initially reducing the model's tendency to "lie" (or generate untruthful statements). However, the subsequent increase suggests that the intervention may have unintended consequences or that the model learns to circumvent the intervention at higher layers. The consistent high score of the "llama3" model indicates that it consistently exhibits a higher tendency to generate untruthful statements, regardless of the layer index. The difference between the two models highlights the potential benefits and risks of applying causal interventions to language models. The sharp change in the "llama3 + causal intervention" model around Layer Index 9-12 is a notable anomaly that warrants further investigation. It could be due to a specific architectural feature or training data characteristic at that layer.