## Flowchart: Data Processing Pipeline Stages
### Overview
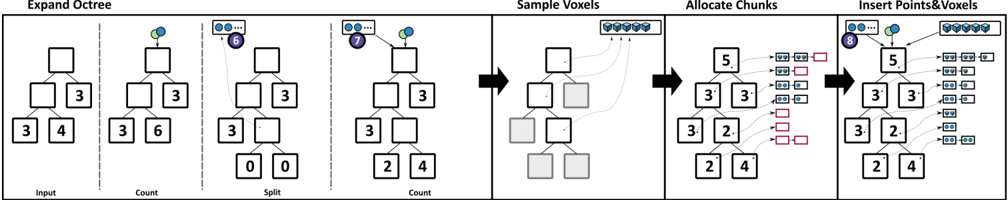
The image depicts a multi-stage data processing pipeline visualized as a flowchart. It illustrates the transformation of input data through sequential operations involving counting, splitting, sampling, chunk allocation, and insertion of points/voxels. The diagram uses numbered boxes, colored circles, and arrows to represent data flow and structural relationships.
### Components/Axes
1. **Stages** (Left to Right):
- Input
- Count
- Split
- Count (repeated)
- Sample Voxels
- Allocate Chunks
- Insert Points&Voxels
2. **Visual Elements**:
- **Boxes**: Contain numerical values (e.g., "3", "4", "6") representing data quantities or counts.
- **Circles**: Colored dots (blue, green, red) likely denote data points or processing nodes.
- **Arrows**: Indicate directional flow between stages.
- **Colored Blocks**: Represent memory chunks or allocated resources (red, blue).
3. **Key Labels**:
- "Expand Octree" (top-left header)
- "Sample Voxels" (middle stage)
- "Allocate Chunks" (second-to-last stage)
- "Insert Points&Voxels" (final stage)
### Detailed Analysis
1. **Input Stage**:
- Contains boxes labeled "3", "4", "3", "3", "6".
- Blue and green circles above the boxes suggest initial data points.
2. **Count Stage**:
- Outputs "3" and "6" in boxes, with a green circle pointing to the "6".
3. **Split Stage**:
- Splits "6" into "3", "0", and "0" (discarding zeros?).
- A blue circle connects to the "3".
4. **Count (Repeated)**:
- Outputs "3" and "4" in boxes.
5. **Sample Voxels**:
- Shows "5", "3", "2", "4" in boxes.
- Arrows connect to colored blocks (blue and red).
6. **Allocate Chunks**:
- Contains "5", "3", "3", "2", "4" in boxes.
- Red and blue blocks represent allocated memory.
7. **Insert Points&Voxels**:
- Final stage with "5", "3", "3", "2", "4" in boxes.
- Blue and green circles connect to colored blocks.
### Key Observations
- **Data Reduction**: Initial counts (e.g., "6" in Split) are reduced to "3" after splitting, with zeros discarded.
- **Structural Growth**: Sample Voxels and Allocate Chunks stages show increasing complexity (e.g., "5" in Sample Voxels vs. "3" in earlier stages).
- **Color Coding**:
- Blue circles likely represent raw data points.
- Green circles may indicate split operations.
- Red blocks denote memory allocation.
- **Final Output**: The Insert Points&Voxels stage integrates all processed data into a structured format.
### Interpretation
This diagram represents a hierarchical data processing workflow, likely for 3D graphics or spatial data analysis. The pipeline begins with raw input data, processes it through counting and splitting (with potential pruning of zero values), samples voxels for spatial representation, allocates memory chunks, and finally inserts structured points and voxels. The use of colors and numbered boxes suggests a systematic approach to resource management and data structuring. The zeros in the Split stage imply a filtering mechanism, while the recurring "3" and "4" values indicate consistent data partitioning. The final stage’s integration of points and voxels implies a focus on geometric or spatial data representation.