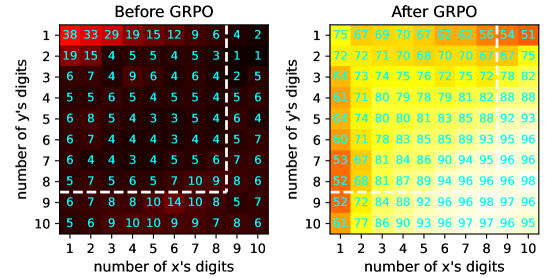
## Heatmap: Comparison of Values Before and After GRPO
### Overview
The image presents two heatmaps side-by-side, visualizing numerical values before and after the application of a process labeled "GRPO". The heatmaps share the same axes, representing the "number of x's digits" and "number of y's digits," both ranging from 1 to 10. The color intensity in each cell corresponds to the magnitude of the numerical value within that cell. A white dashed line is drawn on each heatmap, forming an L-shape.
### Components/Axes
* **Titles:** "Before GRPO" (left heatmap), "After GRPO" (right heatmap)
* **Y-axis Label:** "number of y's digits" (vertical, on both heatmaps)
* **X-axis Label:** "number of x's digits" (horizontal, on both heatmaps)
* **X-axis Markers:** 1, 2, 3, 4, 5, 6, 7, 8, 9, 10 (on both heatmaps)
* **Y-axis Markers:** 1, 2, 3, 4, 5, 6, 7, 8, 9, 10 (on both heatmaps)
* **Data Values:** Numerical values are displayed within each cell of the heatmaps. The color of the cells varies based on the value, ranging from dark red/black (low values) to yellow/white (high values).
### Detailed Analysis
**Left Heatmap (Before GRPO):**
* **General Trend:** The values are generally lower compared to the right heatmap. The highest values are concentrated in the top-left corner.
* **Specific Values:**
* (1,1): 38
* (1,2): 33
* (1,3): 29
* (1,4): 19
* (1,5): 15
* (1,6): 12
* (1,7): 9
* (1,8): 6
* (1,9): 4
* (2,1): 19
* (2,2): 15
* (2,3): 4
* (2,4): 5
* (2,5): 5
* (2,6): 4
* (2,7): 5
* (2,8): 3
* (2,9): 1
* (2,10): 1
* (3,1): 6
* (3,2): 7
* (3,3): 4
* (3,4): 9
* (3,5): 6
* (3,6): 4
* (3,7): 6
* (3,8): 4
* (3,9): 2
* (3,10): 5
* (4,1): 5
* (4,2): 5
* (4,3): 6
* (4,4): 5
* (4,5): 4
* (4,6): 5
* (4,7): 5
* (4,8): 4
* (4,9): 5
* (4,10): 6
* (5,1): 6
* (5,2): 8
* (5,3): 5
* (5,4): 4
* (5,5): 3
* (5,6): 3
* (5,7): 5
* (5,8): 4
* (5,9): 6
* (5,10): 4
* (6,1): 6
* (6,2): 7
* (6,3): 4
* (6,4): 4
* (6,5): 4
* (6,6): 3
* (6,7): 4
* (6,8): 4
* (6,9): 5
* (6,10): 7
* (7,1): 6
* (7,2): 4
* (7,3): 4
* (7,4): 3
* (7,5): 4
* (7,6): 5
* (7,7): 5
* (7,8): 6
* (7,9): 7
* (7,10): 6
* (8,1): 5
* (8,2): 7
* (8,3): 5
* (8,4): 6
* (8,5): 5
* (8,6): 7
* (8,7): 10
* (8,8): 9
* (8,9): 8
* (8,10): 6
* (9,1): 6
* (9,2): 7
* (9,3): 8
* (9,4): 8
* (9,5): 10
* (9,6): 14
* (9,7): 10
* (9,8): 8
* (9,9): 5
* (9,10): 7
* (10,1): 5
* (10,2): 6
* (10,3): 9
* (10,4): 10
* (10,5): 10
* (10,6): 9
* (10,7): 9
* (10,8): 7
* (10,9): 8
* (10,10): 6
**Right Heatmap (After GRPO):**
* **General Trend:** The values are significantly higher compared to the left heatmap. The heatmap is predominantly yellow and white, indicating high values across the board.
* **Specific Values:**
* (1,1): 75
* (1,2): 67
* (1,3): 69
* (1,4): 70
* (1,5): 67
* (1,6): 67
* (1,7): 67
* (1,8): 56
* (1,9): 54
* (1,10): 51
* (2,1): 72
* (2,2): 72
* (2,3): 71
* (2,4): 70
* (2,5): 68
* (2,6): 70
* (2,7): 70
* (2,8): 67
* (2,9): 67
* (2,10): 75
* (3,1): 64
* (3,2): 73
* (3,3): 74
* (3,4): 75
* (3,5): 76
* (3,6): 72
* (3,7): 75
* (3,8): 72
* (3,9): 78
* (3,10): 82
* (4,1): 61
* (4,2): 71
* (4,3): 80
* (4,4): 79
* (4,5): 78
* (4,6): 79
* (4,7): 81
* (4,8): 82
* (4,9): 88
* (4,10): 88
* (5,1): 64
* (5,2): 74
* (5,3): 80
* (5,4): 80
* (5,5): 81
* (5,6): 83
* (5,7): 85
* (5,8): 88
* (5,9): 92
* (5,10): 93
* (6,1): 60
* (6,2): 71
* (6,3): 78
* (6,4): 83
* (6,5): 85
* (6,6): 85
* (6,7): 89
* (6,8): 93
* (6,9): 95
* (6,10): 96
* (7,1): 53
* (7,2): 67
* (7,3): 81
* (7,4): 84
* (7,5): 86
* (7,6): 90
* (7,7): 94
* (7,8): 95
* (7,9): 96
* (7,10): 96
* (8,1): 52
* (8,2): 68
* (8,3): 81
* (8,4): 87
* (8,5): 89
* (8,6): 94
* (8,7): 96
* (8,8): 96
* (8,9): 96
* (8,10): 98
* (9,1): 52
* (9,2): 72
* (9,3): 84
* (9,4): 88
* (9,5): 92
* (9,6): 96
* (9,7): 96
* (9,8): 98
* (9,9): 97
* (9,10): 96
* (10,1): 61
* (10,2): 77
* (10,3): 86
* (10,4): 90
* (10,5): 93
* (10,6): 96
* (10,7): 97
* (10,8): 97
* (10,9): 96
* (10,10): 95
### Key Observations
* The "GRPO" process significantly increases the values across all combinations of x and y digits.
* The white dashed line seems to separate regions of different performance or behavior, but without further context, its exact meaning is unclear.
* The top-left corner shows the most significant improvement after applying "GRPO".
### Interpretation
The heatmaps demonstrate the effectiveness of the "GRPO" process in increasing the measured values, whatever they represent. The axes "number of x's digits" and "number of y's digits" likely refer to input parameters or characteristics of a system being evaluated. The "GRPO" process appears to optimize or enhance the system's performance across various combinations of these parameters. The white dashed line might indicate a threshold or boundary related to the application of "GRPO," or it could delineate regions where the process has varying degrees of impact. Further context is needed to fully understand the meaning of the values and the significance of the dashed line.