## Heatmap: Performance Metrics Before and After GRPO
### Overview
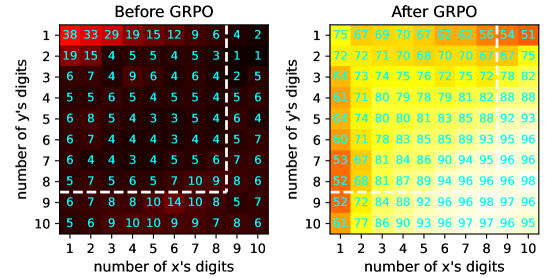
The image presents two side-by-side heatmaps comparing performance metrics (likely accuracy or success rates) across combinations of "number of x's digits" (1-10) and "number of y's digits" (1-10). The left heatmap shows values "Before GRPO," while the right shows values "After GRPO." Color gradients indicate magnitude, with darker colors representing lower values and lighter colors representing higher values.
### Components/Axes
- **X-axis**: "number of x's digits" (1-10)
- **Y-axis**: "number of y's digits" (1-10)
- **Color Scale**:
- **Before GRPO**: Dark red (low) → Black (high)
- **After GRPO**: Yellow (low) → Light blue (high)
- **Data Values**: Numerical annotations in each cell represent metric values.
### Detailed Analysis
#### Before GRPO
- **Range**: 1 (minimum) to 38 (maximum)
- **Distribution**:
- Top-left (1x1): 38 (darkest red)
- Bottom-right (10x10): 6 (dark red)
- Middle values cluster between 4-15 (e.g., 1x2: 15, 5x5: 5)
- **Trend**: Values decrease diagonally from top-left to bottom-right.
#### After GRPO
- **Range**: 51 (minimum) to 98 (maximum)
- **Distribution**:
- Top-left (1x1): 75 (light yellow)
- Bottom-right (10x10): 98 (light blue)
- Middle values cluster between 60-97 (e.g., 5x5: 85, 8x8: 96)
- **Trend**: Values increase diagonally from top-left to bottom-right.
### Key Observations
1. **Magnitude Shift**: All values increased post-GRPO, with the lowest value rising from 1 to 51 and the highest from 38 to 98.
2. **Consistent Improvement**: Every cell shows improvement, with no outliers or declines.
3. **Color Gradient Alignment**: Darker colors (Before) correlate with lower values; lighter colors (After) correlate with higher values.
4. **Diagonal Patterns**: Both heatmaps exhibit diagonal trends, but the direction reverses post-GRPO.
### Interpretation
The data suggests GRPO significantly enhances performance across all digit-length combinations. The most dramatic improvements occur in lower-digit pairs (e.g., 1x1, 2x2), where values nearly tripled (38→75). Higher-digit pairs (e.g., 10x10) show more modest gains (6→98), indicating GRPO’s impact may scale with problem complexity. The consistent upward trend implies GRPO optimizes the underlying process uniformly, though the exact mechanism (e.g., algorithmic efficiency, error reduction) requires further investigation. The absence of declines suggests no negative side effects in the measured metric.