\n
## Diagram: Argument Graph & Prescription Logic
### Overview
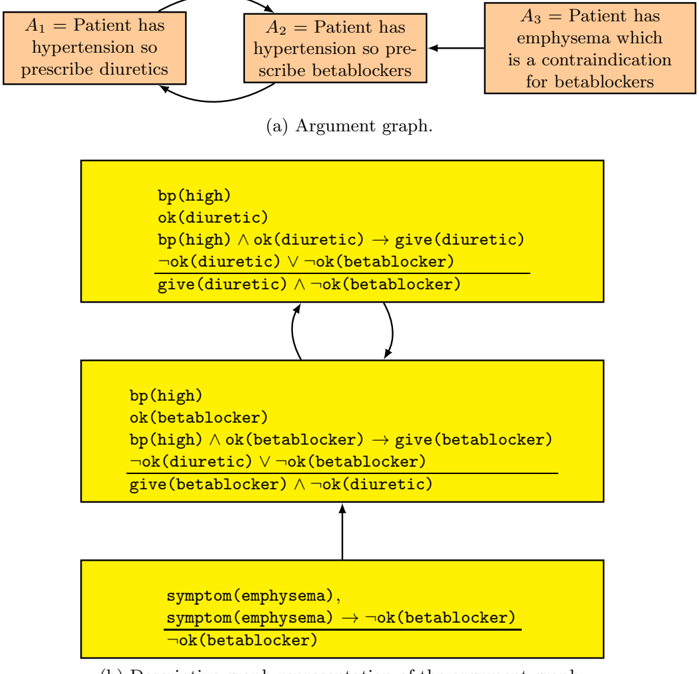
The image presents a diagram illustrating an argument graph and its corresponding prescription logic for medical treatments. The diagram consists of three main sections, each represented by a yellow rectangle, connected by arrows indicating the flow of reasoning. The top section defines the arguments, while the lower sections detail the logical implications for prescribing diuretics and beta-blockers based on patient conditions.
### Components/Axes
The diagram is structured as follows:
* **Top Section:** Contains three arguments labeled A1, A2, and A3.
* A1: "Patient has hypertension so prescribe diuretics"
* A2: "Patient has hypertension so prescribe beta-blockers"
* A3: "Patient has emphysema which is a contraindication for beta-blockers"
* **Middle Section:** Represents the logic for prescribing diuretics.
* **Bottom Section:** Represents the logic for prescribing beta-blockers.
* **Arrows:** Indicate the flow of reasoning and dependencies between arguments and prescriptions.
### Detailed Analysis or Content Details
**Top Section (Arguments):**
* A1 is linked to the middle section.
* A2 is linked to the middle section.
* A3 is linked to the bottom section.
**Middle Section (Diuretic Prescription Logic):**
* `bp(high)`: Blood pressure is high.
* `ok(diuretic)`: Diuretics are okay for the patient.
* `bp(high) ∧ ok(diuretic) → give(diuretic)`: If blood pressure is high AND diuretics are okay, then give diuretics.
* `¬ok(diuretic) ∨ ¬ok(betablocker)`: Not okay for diuretics OR not okay for beta-blockers.
* `give(diuretic) ∧ ¬ok(betablocker)`: Give diuretics AND beta-blockers are not okay.
**Bottom Section (Beta-blocker Prescription Logic):**
* `bp(high)`: Blood pressure is high.
* `ok(betablocker)`: Beta-blockers are okay for the patient.
* `bp(high) ∧ ok(betablocker) → give(betablocker)`: If blood pressure is high AND beta-blockers are okay, then give beta-blockers.
* `¬ok(diuretic) ∨ ¬ok(betablocker)`: Not okay for diuretics OR not okay for beta-blockers.
* `give(betablocker) ∧ ¬ok(diuretic)`: Give beta-blockers AND diuretics are not okay.
* `symptom(emphysema)`: Patient has emphysema.
* `symptom(emphysema) → ¬ok(betablocker)`: If patient has emphysema, then beta-blockers are not okay.
* `¬ok(betablocker)`: Beta-blockers are not okay.
### Key Observations
* The diagram illustrates a decision-making process for prescribing medications based on patient conditions.
* The presence of emphysema (A3) directly impacts the suitability of beta-blockers.
* The logic uses conjunctions (∧), negations (¬), and implications (→) to represent the relationships between conditions and prescriptions.
* The diagram highlights the importance of considering contraindications (emphysema) when prescribing medications.
### Interpretation
The diagram demonstrates a simplified model of clinical reasoning. It shows how arguments about a patient's condition (hypertension, emphysema) are translated into logical rules for prescribing medications. The use of logical operators allows for a structured and consistent approach to decision-making. The diagram suggests that if a patient has high blood pressure and diuretics are deemed safe, diuretics should be prescribed. Conversely, if a patient has emphysema, beta-blockers should not be prescribed. The diagram is a visual representation of a rule-based system, where specific conditions trigger specific actions. The diagram is a formalization of medical knowledge, making it easier to understand and implement in automated decision support systems. The diagram is a clear example of how logic can be used to represent and reason about medical knowledge. The diagram is a useful tool for understanding the complex relationships between patient conditions, medications, and treatment decisions.