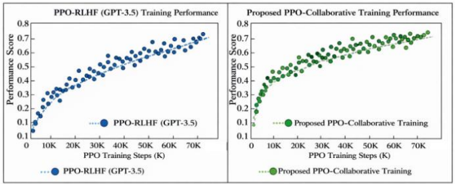
## Chart: Training Performance Comparison
### Overview
The image presents a comparative analysis of training performance for two different approaches: PPO-RLHF (GPT-3.5) and a proposed PPO-Collaborative Training method. Both are visualized as scatter plots showing Performance Score against PPO Training Steps (in thousands). The charts are presented side-by-side for direct comparison.
### Components/Axes
* **X-axis (Both Charts):** PPO Training Steps (K) - Scale ranges from 0K to 70K, with markers at 10K, 20K, 30K, 40K, 50K, 60K, and 70K.
* **Y-axis (Both Charts):** Performance Score - Scale ranges from 0.1 to 0.8, with markers at 0.1, 0.2, 0.3, 0.4, 0.5, 0.6, 0.7, and 0.8.
* **Left Chart:**
* Title: "PPO-RLHF (GPT-3.5) Training Performance"
* Data Series: PPO-RLHF (GPT-3.5) - Represented by blue circles.
* Legend: Located at the bottom-center, labeled "PPO-RLHF (GPT-3.5)" with a blue dotted line.
* **Right Chart:**
* Title: "Proposed PPO-Collaborative Training Performance"
* Data Series: Proposed PPO-Collaborative Training - Represented by green circles.
* Legend: Located at the bottom-center, labeled "Proposed PPO-Collaborative Training" with a green dotted line.
### Detailed Analysis
**Left Chart - PPO-RLHF (GPT-3.5):**
The blue data series shows an upward trend, starting at approximately 0.12 at 0K steps. The performance score increases rapidly up to around 30K steps, reaching approximately 0.5. From 30K to 70K steps, the rate of increase slows down, with the score plateauing around 0.72 at 70K steps.
* Approximate Data Points:
* 0K: 0.12
* 10K: 0.25
* 20K: 0.40
* 30K: 0.50
* 40K: 0.58
* 50K: 0.64
* 60K: 0.68
* 70K: 0.72
**Right Chart - Proposed PPO-Collaborative Training:**
The green data series also exhibits an upward trend, but appears to be consistently higher than the PPO-RLHF (GPT-3.5) performance. It starts at approximately 0.15 at 0K steps. The performance score increases rapidly up to around 30K steps, reaching approximately 0.55. From 30K to 70K steps, the rate of increase slows down, but remains higher than the blue series, reaching approximately 0.78 at 70K steps.
* Approximate Data Points:
* 0K: 0.15
* 10K: 0.28
* 20K: 0.45
* 30K: 0.55
* 40K: 0.65
* 50K: 0.70
* 60K: 0.75
* 70K: 0.78
### Key Observations
* The proposed PPO-Collaborative Training consistently outperforms the PPO-RLHF (GPT-3.5) method across all training steps.
* Both methods exhibit diminishing returns in performance gains as the number of training steps increases.
* The initial learning phase (0K to 30K steps) shows the most significant performance improvement for both methods.
### Interpretation
The data suggests that the proposed PPO-Collaborative Training approach is more effective than the standard PPO-RLHF (GPT-3.5) method for this particular task. The consistently higher performance scores indicate that the collaborative training strategy leads to better model learning and optimization. The diminishing returns observed at higher training steps suggest that further training beyond a certain point may not yield significant improvements. This could be due to the model reaching its capacity or the need for more sophisticated training techniques. The difference in performance is most pronounced in the initial stages of training, indicating that the collaborative approach is particularly beneficial for accelerating the learning process. The charts provide empirical evidence supporting the potential advantages of the proposed training method.