## Scatter Plot: Dimensionality Reduction of Text Data
### Overview
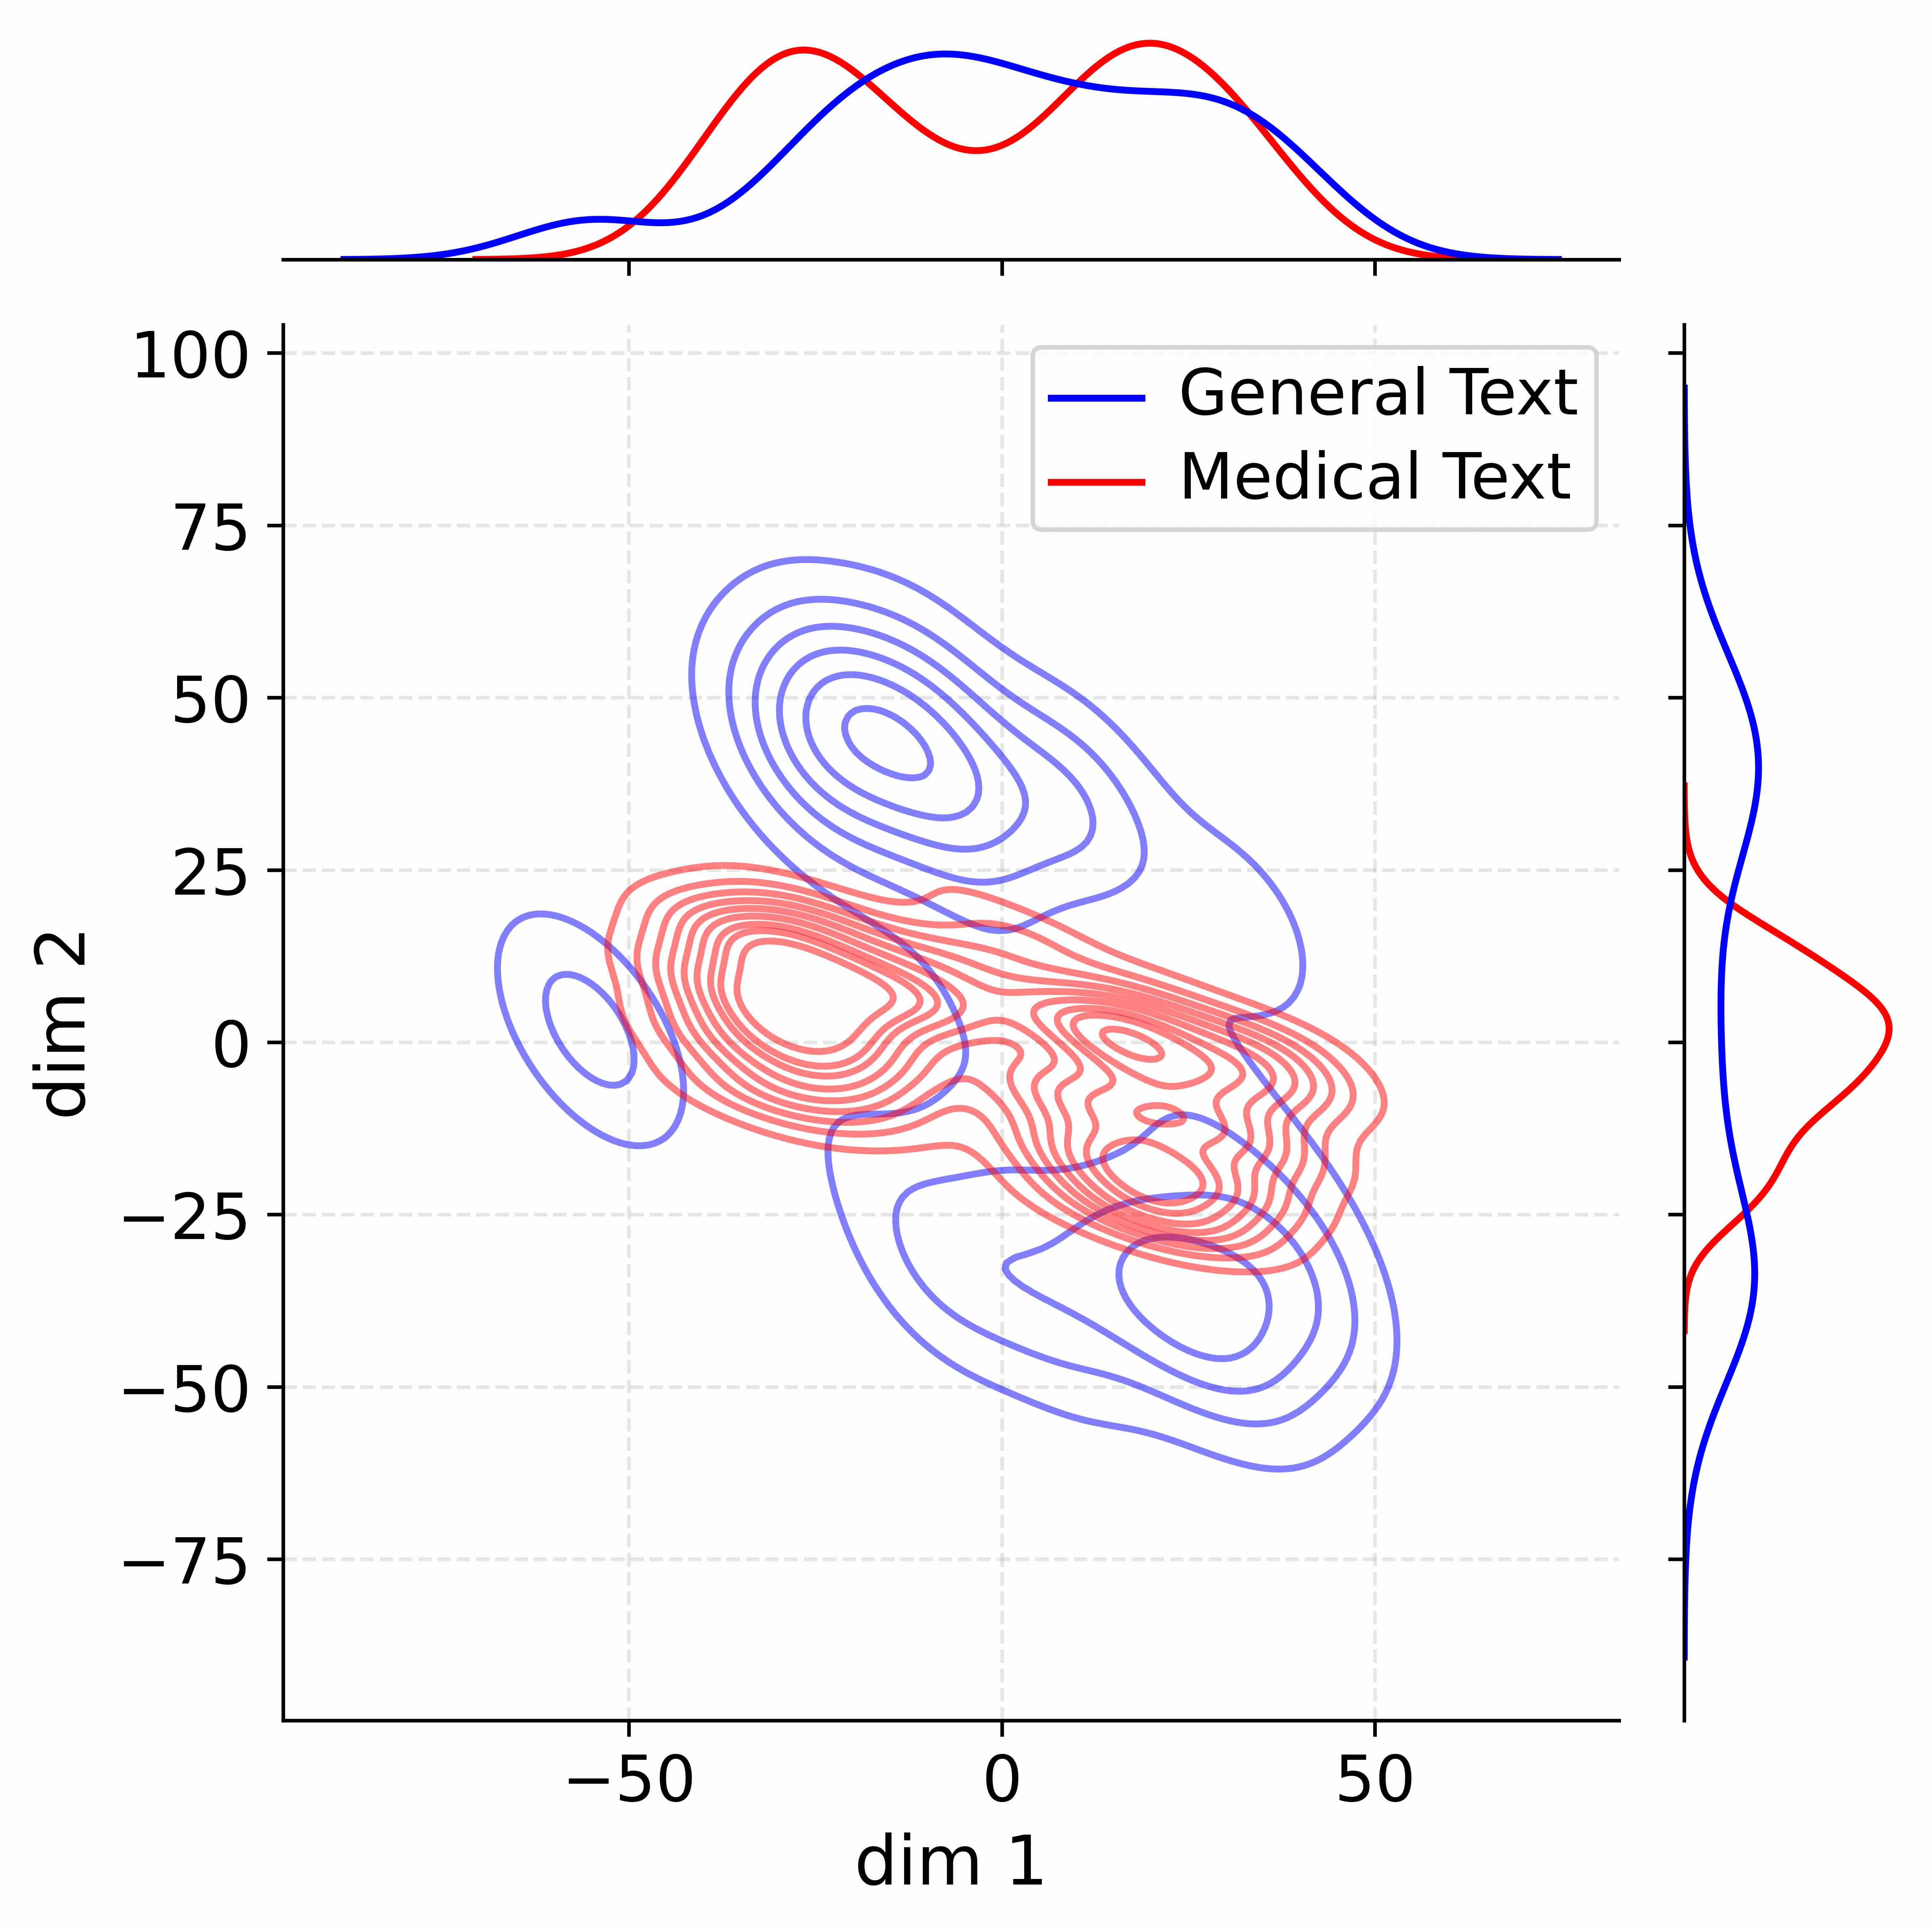
The image presents a scatter plot visualizing the dimensionality reduction of two text datasets: "General Text" and "Medical Text". The plot uses contour lines to represent the density of data points for each text type, projected onto two dimensions ("dim 1" and "dim 2"). Marginal distributions (histograms) are shown along the top and right edges, indicating the distribution of data points along each dimension for each text type.
### Components/Axes
* **X-axis:** Labeled "dim 1", ranging approximately from -60 to 60.
* **Y-axis:** Labeled "dim 2", ranging approximately from -80 to 100.
* **Legend:** Located in the top-right corner.
* "General Text" - represented by a blue line and contour.
* "Medical Text" - represented by a red line and contour.
* **Marginal Distributions:** Histograms displayed along the top and right edges of the plot.
* Top Histogram: Shows the distribution of data points along "dim 1" for both "General Text" (blue) and "Medical Text" (red).
* Right Histogram: Shows the distribution of data points along "dim 2" for both "General Text" (blue) and "Medical Text" (red).
* **Contour Lines:** Represent density of data points. Blue contours represent "General Text", and red contours represent "Medical Text".
### Detailed Analysis
The scatter plot shows a clear separation between the "General Text" and "Medical Text" datasets.
**Scatter Plot Analysis:**
* The "General Text" data (blue contours) is concentrated in the left-center region of the plot, with a primary cluster around dim1 = -20 to 20 and dim2 = -20 to 40. The contours are more elongated vertically.
* The "Medical Text" data (red contours) is concentrated in the right-center region of the plot, with a primary cluster around dim1 = 20 to 50 and dim2 = 0 to 50. The contours are more elongated horizontally.
* There is some overlap between the two datasets, particularly in the center of the plot, but the overall separation is significant.
**Marginal Distribution Analysis:**
* **dim 1 (Top Histogram):** The "General Text" distribution (blue) is roughly symmetrical around dim1 = 0, with a peak around dim1 = -10. The "Medical Text" distribution (red) is skewed to the right, with a peak around dim1 = 30.
* **dim 2 (Right Histogram):** The "General Text" distribution (blue) is relatively uniform between dim2 = -60 and dim2 = 80, with a slight peak around dim2 = 20. The "Medical Text" distribution (red) is concentrated between dim2 = 0 and dim2 = 80, with a peak around dim2 = 40.
### Key Observations
* The two text types are largely separable in this two-dimensional space.
* "Medical Text" tends to have higher values on "dim 1" and "dim 2" compared to "General Text".
* The marginal distributions confirm the separation observed in the scatter plot.
* The contour lines indicate that the "General Text" data is more spread out along "dim 2", while the "Medical Text" data is more spread out along "dim 1".
### Interpretation
This plot likely represents the results of a dimensionality reduction technique (e.g., PCA, t-SNE) applied to text data. The goal is to visualize high-dimensional text data in a lower-dimensional space while preserving the relationships between data points.
The clear separation between "General Text" and "Medical Text" suggests that these two types of text have distinct characteristics in terms of their underlying features (e.g., word usage, topic distribution). The dimensionality reduction technique has successfully captured these differences and projected them onto the two dimensions "dim 1" and "dim 2".
The marginal distributions provide additional insights into the characteristics of each text type. The skewness of the "Medical Text" distribution along "dim 1" suggests that medical text tends to have higher values on this dimension, potentially indicating a stronger presence of certain features associated with medical language. The concentration of "Medical Text" along "dim 2" suggests a similar pattern for this dimension.
The overlap between the two datasets indicates that there is some similarity between "General Text" and "Medical Text", and that the separation is not perfect. This could be due to the presence of medical terms in general text, or vice versa.