## 2D Contour Plot with Marginal Histograms: Distribution of Text Types
### Overview
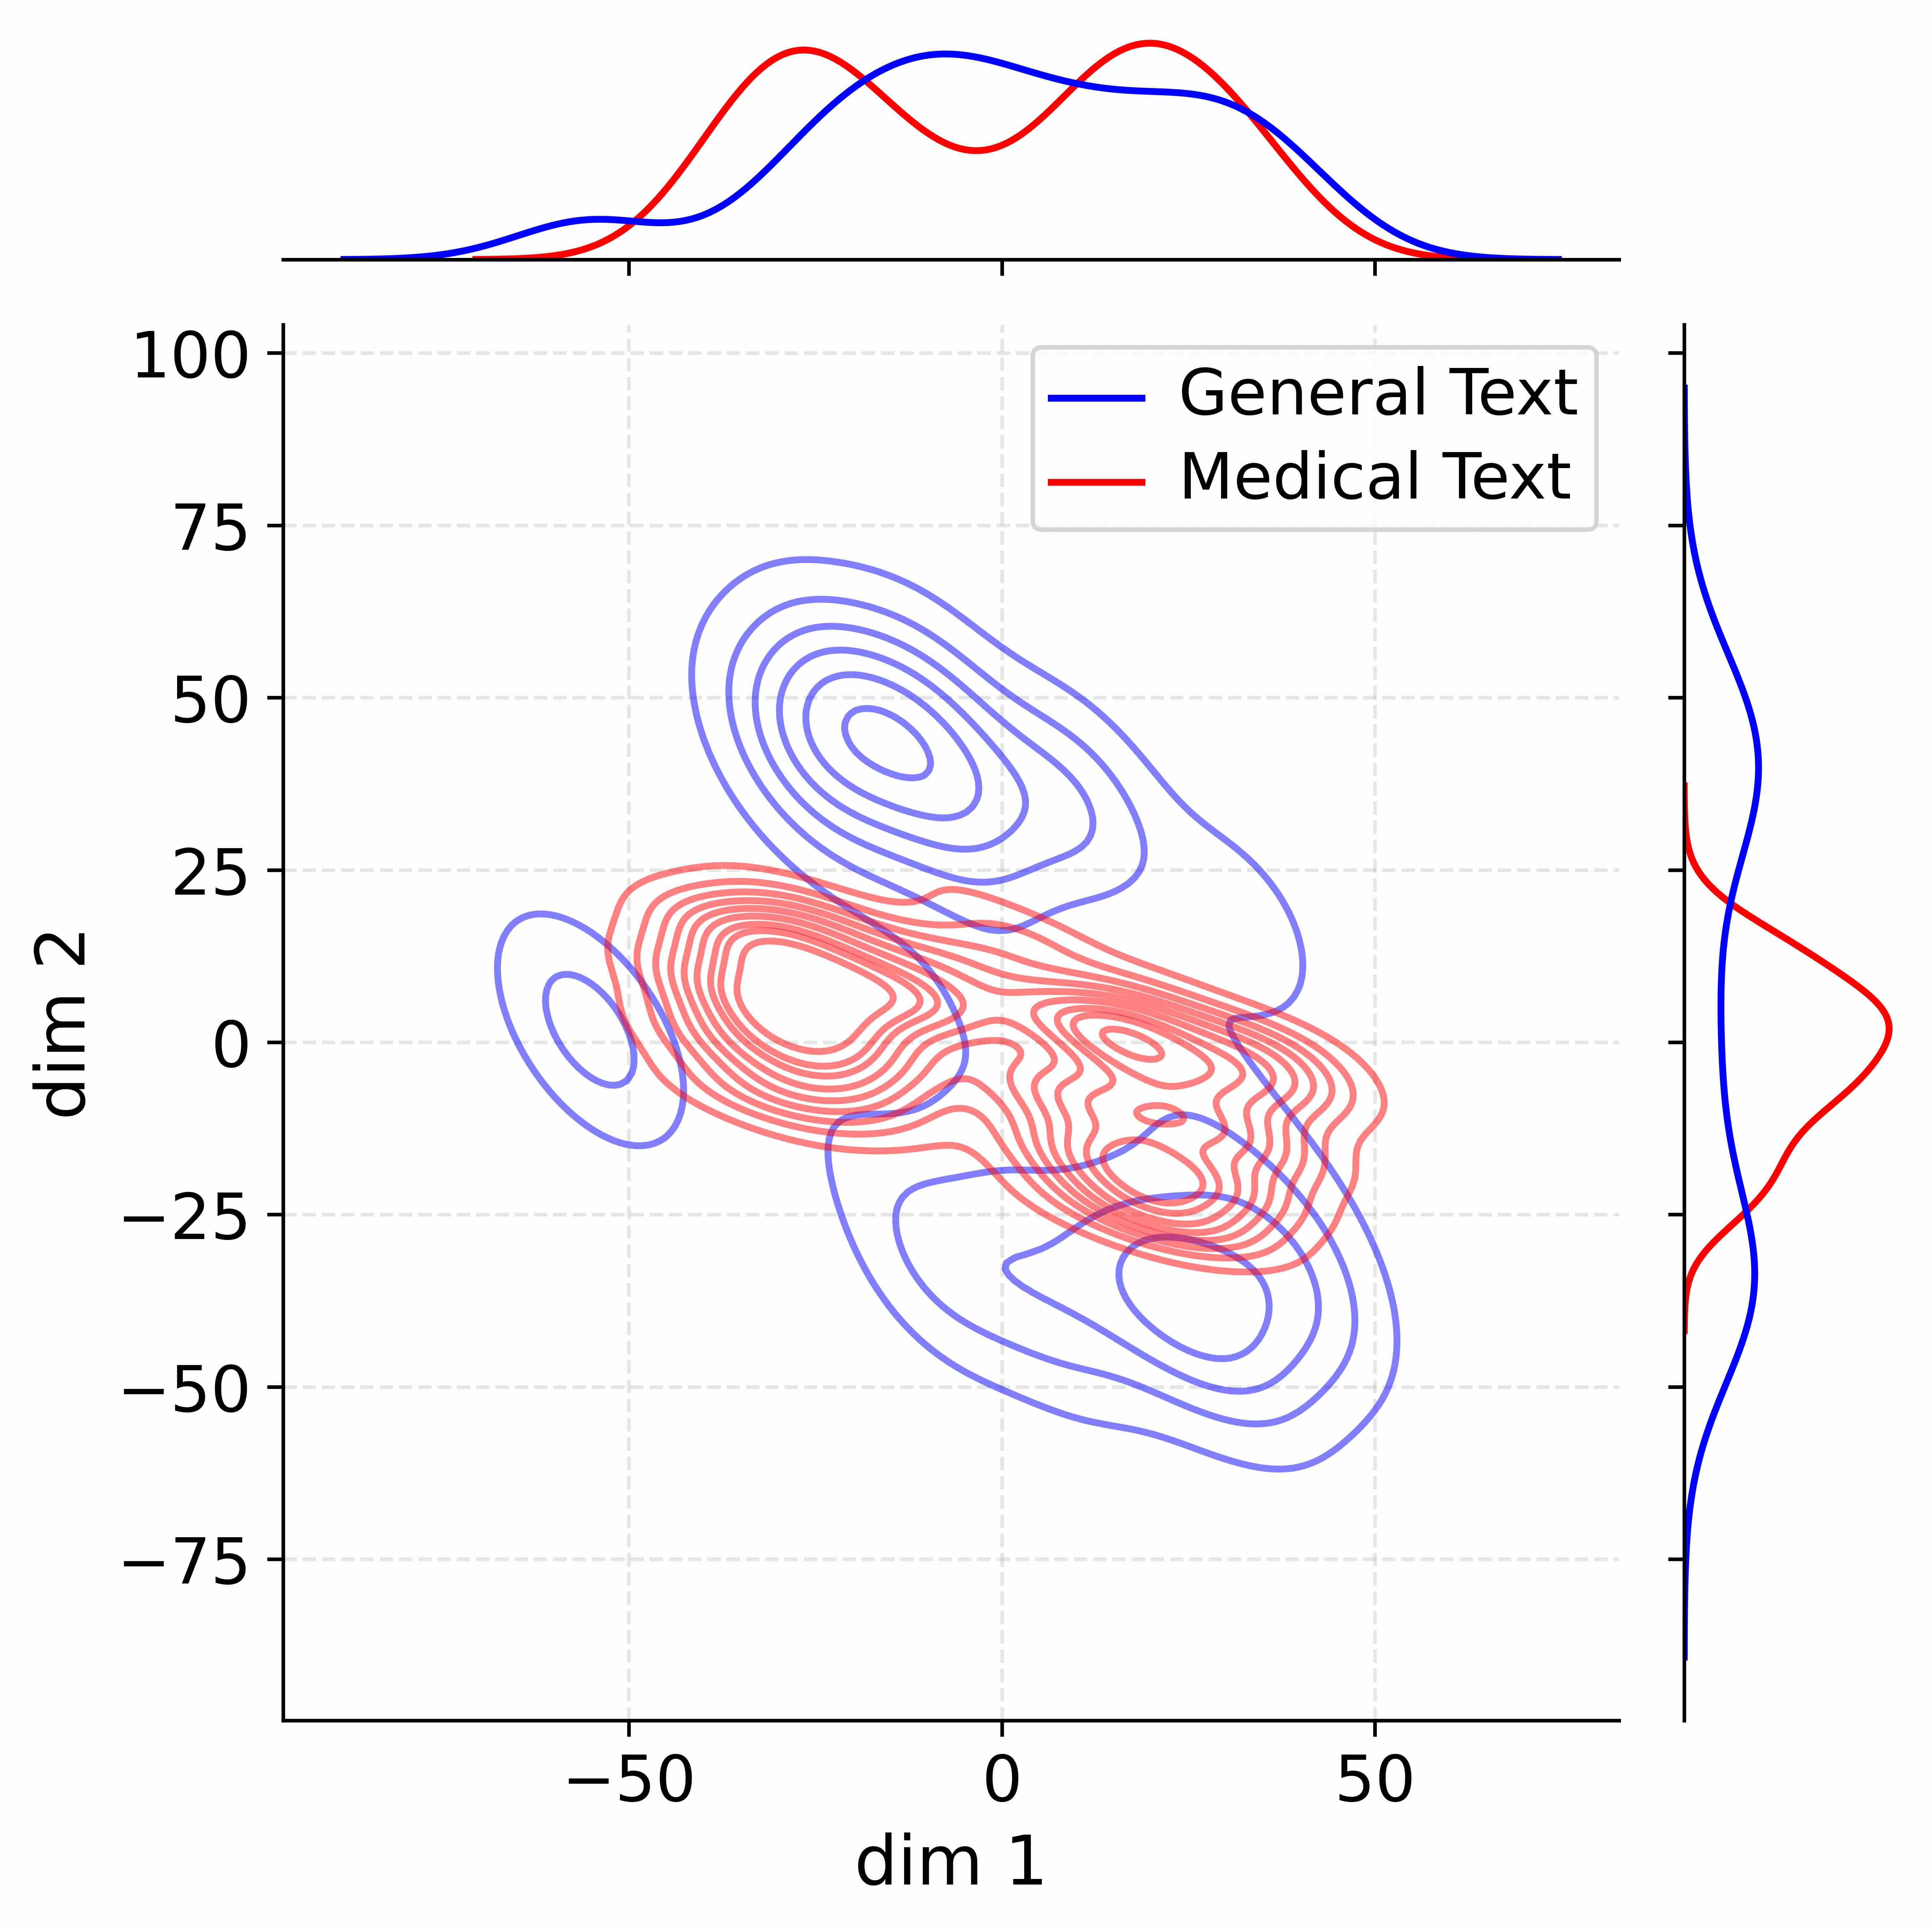
The image displays a 2D contour plot comparing two text types (General Text and Medical Text) across two dimensions (dim 1 and dim 2). Marginal histograms are overlaid on the top and right edges of the plot. The data is represented by contour lines and marginal distributions, with a legend distinguishing the two categories.
### Components/Axes
- **X-axis (dim 1)**: Ranges from -75 to 75, labeled "dim 1".
- **Y-axis (dim 2)**: Ranges from -75 to 100, labeled "dim 2".
- **Legend**: Located in the top-right corner, with:
- **Blue**: General Text
- **Red**: Medical Text
- **Marginal Histograms**:
- **Top histogram**: Represents dim 1 distributions (blue and red).
- **Right histogram**: Represents dim 2 distributions (blue and red).
### Detailed Analysis
#### Contour Plot
- **General Text (Blue)**:
- Contour lines are spread across a wider range of dim 1 (-50 to 50) and dim 2 (-75 to 25).
- Density peaks are less pronounced, with multiple overlapping regions.
- Marginal histogram (top) shows two peaks near dim 1 ≈ -10 and dim 1 ≈ 10.
- Marginal histogram (right) peaks near dim 2 ≈ -25.
- **Medical Text (Red)**:
- Contour lines are tightly clustered around dim 1 ≈ 0 and dim 2 ≈ -25.
- Density is highest near the center of the red region.
- Marginal histogram (top) shows a single peak at dim 1 ≈ 0.
- Marginal histogram (right) peaks near dim 2 ≈ -25, with a narrower spread than General Text.
#### Key Observations
1. **Distribution Differences**:
- Medical Text is concentrated around (dim 1 ≈ 0, dim 2 ≈ -25), while General Text is more dispersed.
- Overlap occurs in the central region (dim 1 ≈ -10 to 10, dim 2 ≈ -25 to 25), but Medical Text dominates in the core area.
2. **Marginal Histogram Trends**:
- **dim 1**:
- General Text: Bimodal distribution (peaks at -10 and 10).
- Medical Text: Unimodal distribution (peak at 0).
- **dim 2**:
- Both text types peak near -25, but Medical Text has a sharper peak.
3. **Spatial Grounding**:
- Legend is positioned in the top-right corner, clearly associating colors with text types.
- Contour lines for General Text (blue) are more diffuse, while Medical Text (red) lines are tightly packed.
### Interpretation
The data suggests distinct clustering patterns between General Text and Medical Text in a two-dimensional latent space. Medical Text exhibits a concentrated distribution around (0, -25), potentially indicating specialized or domain-specific content. General Text, by contrast, shows broader variability, with bimodal tendencies in dim 1 and a wider spread in dim 2. The marginal histograms reinforce these differences, highlighting the need for targeted analysis when distinguishing text types. The overlap in the central region implies some shared characteristics, but the dominant clustering of Medical Text suggests it occupies a unique subspace.