## Diagram: Federated Learning Process Flow
### Overview
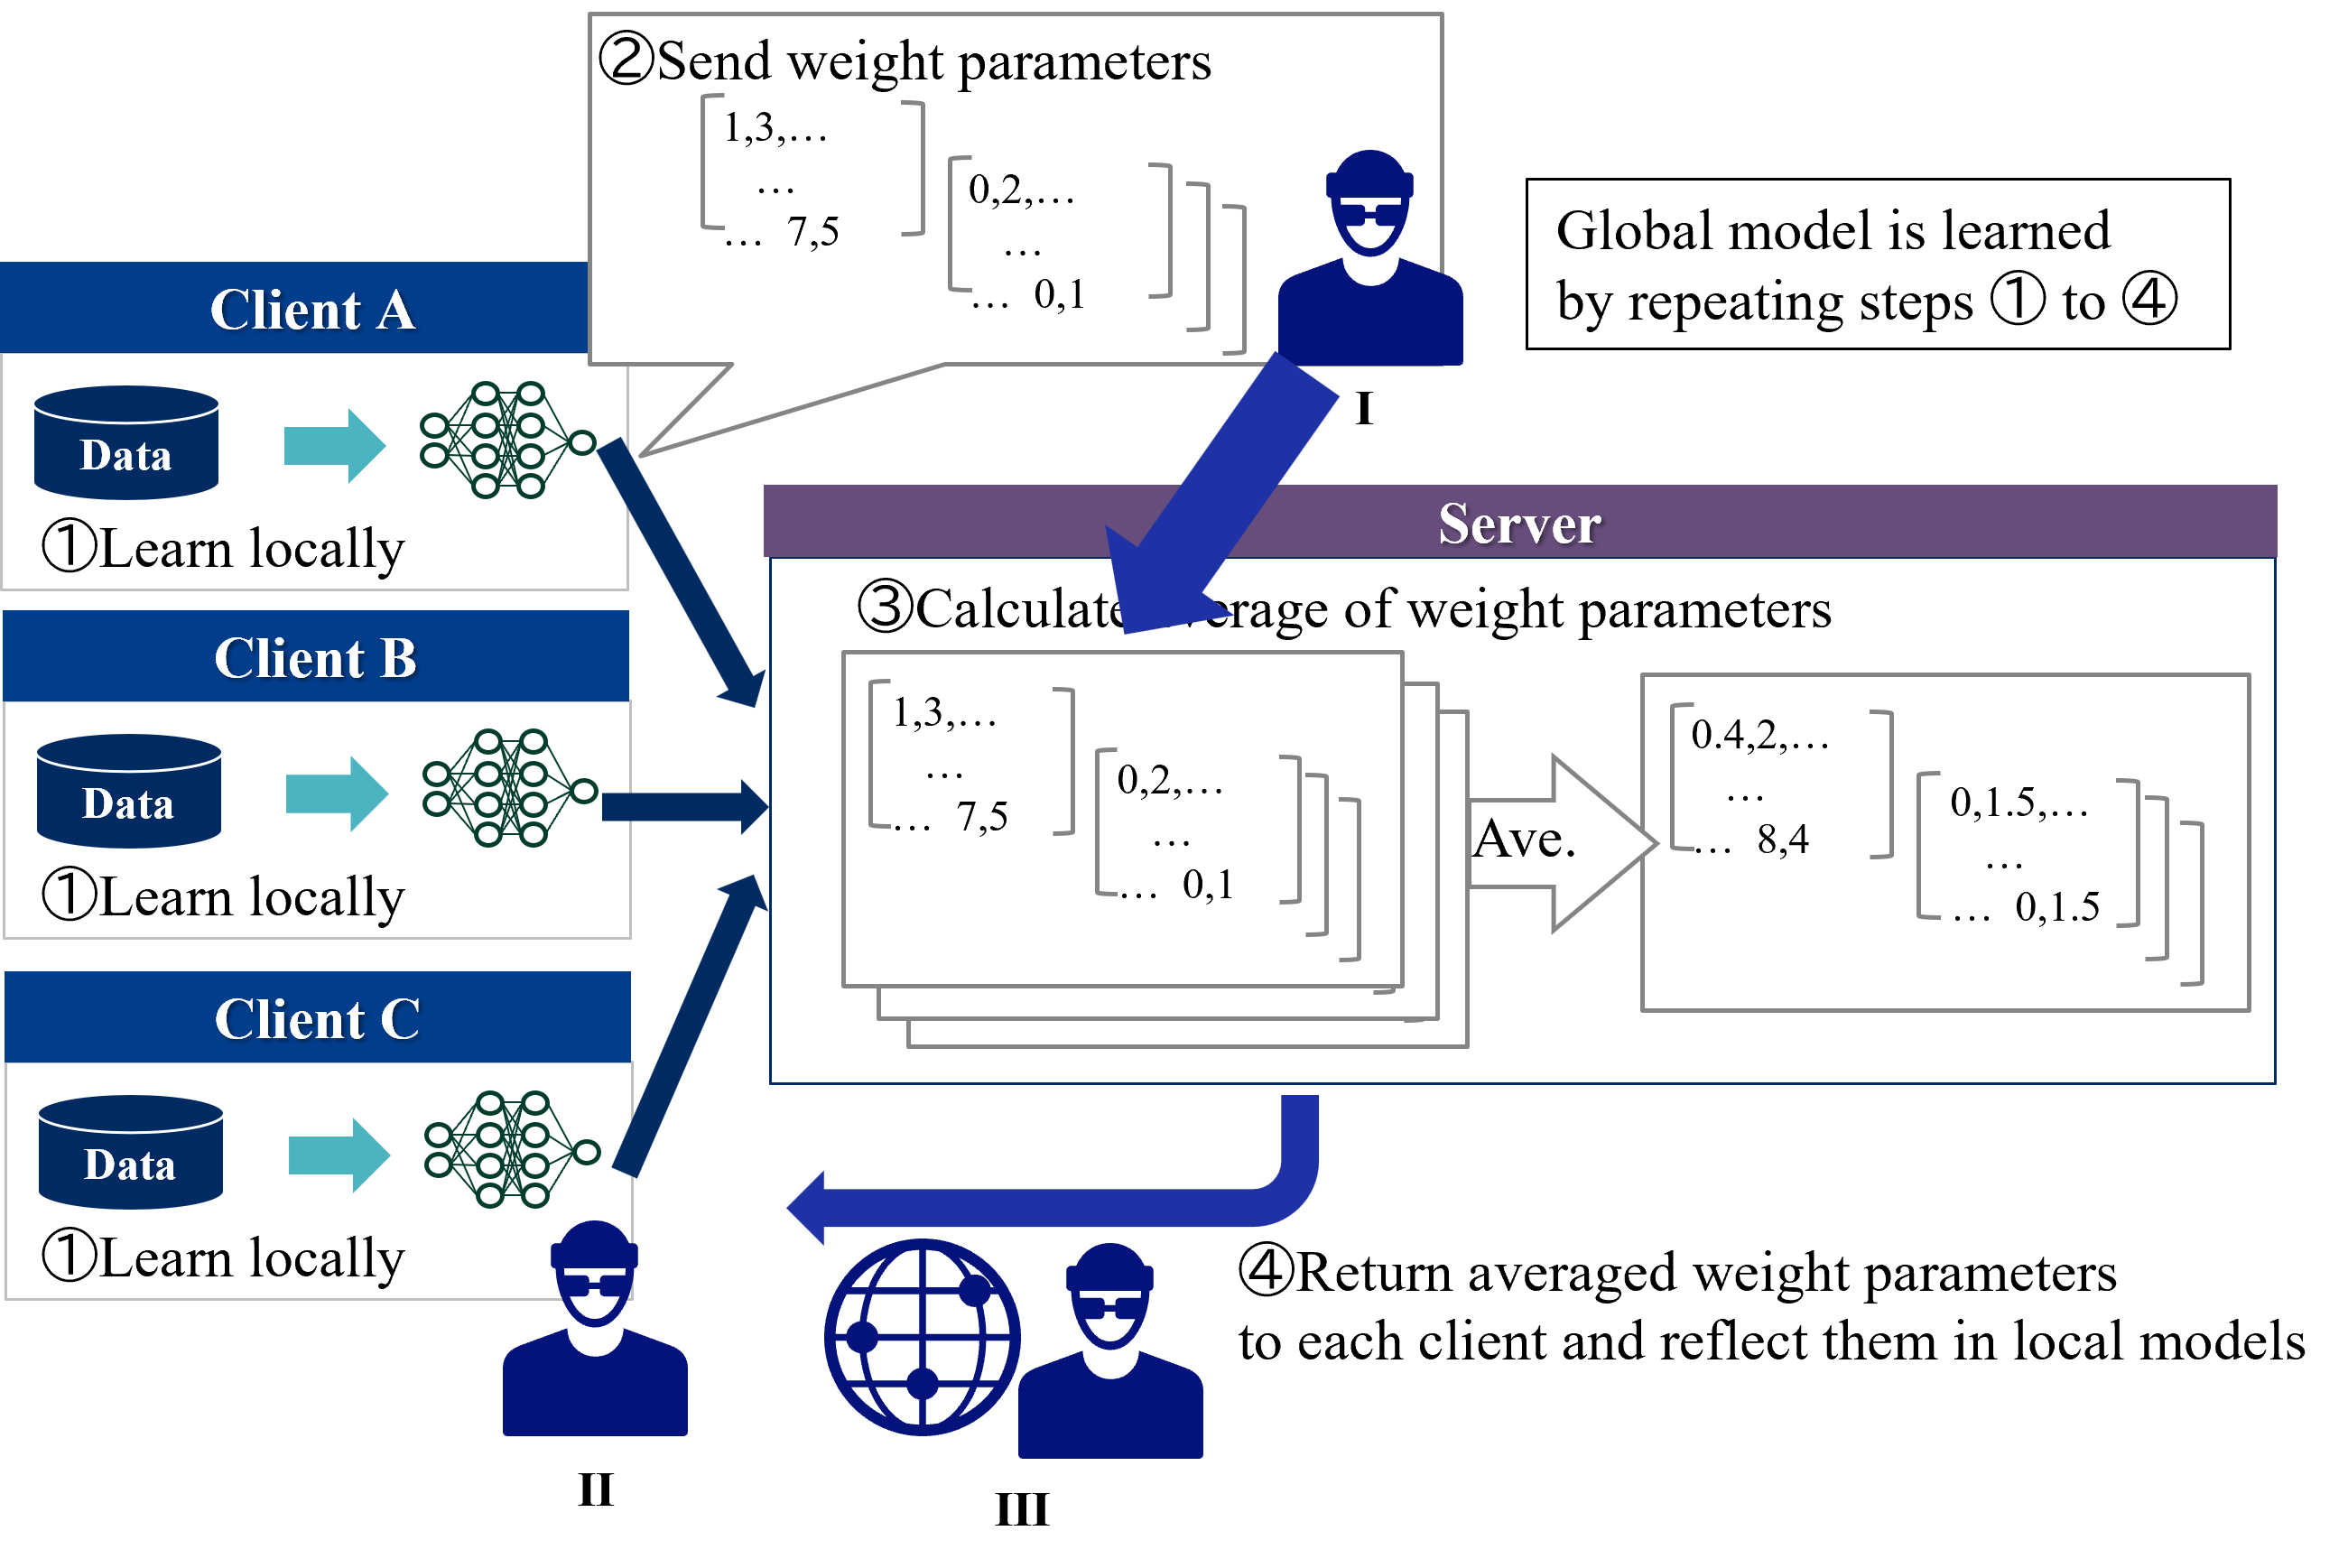
The image is a technical process diagram illustrating the architecture and workflow of Federated Learning. It depicts a distributed system where multiple clients (Client A, Client B, Client C) train a model locally on their own data and communicate only weight parameters—not raw data—to a central server. The server aggregates these weights to update a global model, which is then distributed back to the clients.
### Components/Axes
* **Clients (Left Column):** Three distinct rectangular regions labeled "Client A", "Client B", and "Client C". Each contains:
* A database icon labeled "Data".
* A neural network icon (nodes and connections).
* A label "① Learn locally" below the neural network.
* **Server (Center/Right):** A large, central rectangular box labeled "Server".
* **Process Steps:** Numbered steps 1 through 4, describing the iterative lifecycle of the model.
* **Entities:** Three stylized human figures labeled "I", "II", and "III".
* **Mathematical Notation:** Matrix-like brackets representing weight tensors (e.g., `[1,3,... ... 7,5]`).
### Detailed Analysis
#### 1. Local Training (Step 1)
* **Position:** Left side, within each Client block.
* **Action:** Each client processes its local "Data" through a neural network.
* **Label:** "① Learn locally".
#### 2. Weight Transmission (Step 2)
* **Position:** Top-center, originating from the clients and pointing toward the Server.
* **Action:** Clients send their learned weight parameters to the server.
* **Label:** "② Send weight parameters".
* **Notation:** The weights are represented as matrices:
* Matrix 1: `[1,3,... ... 7,5]`
* Matrix 2: `[0,2,... ... 0,1]`
#### 3. Aggregation (Step 3)
* **Position:** Center of the Server box.
* **Action:** The server receives multiple weight matrices, stacks them, and calculates the average.
* **Label:** "③ Calculate average of weight parameters".
* **Notation:** The diagram shows multiple overlapping matrices entering an "Ave." (Average) function block.
* **Output:** The resulting averaged weights are shown as:
* Matrix 1: `[0.4,2,... ... 8,4]`
* Matrix 2: `[0,1.5,... ... 0,1.5]`
#### 4. Model Update (Step 4)
* **Position:** Bottom-center, pointing from the Server back to the Clients.
* **Action:** The server returns the averaged weights to the clients to update their local models.
* **Label:** "④ Return averaged weight parameters to each client and reflect them in local models".
#### 5. Global Context
* **Position:** Top-right, inside a text box.
* **Text:** "Global model is learned by repeating steps 1 to 4".
### Key Observations
* **Privacy Preservation:** The diagram explicitly shows "Data" icons remaining within the Client blocks, while only "weight parameters" move to the server. This visually confirms that raw data is never shared.
* **Iterative Nature:** The text in the top-right box confirms this is a cyclic process, not a one-time event.
* **Mathematical Abstraction:** The matrices are symbolic representations of high-dimensional tensors used in deep learning. The values (e.g., `0.4`, `1.5`) are illustrative placeholders rather than specific data points.
* **Entities:** The figures labeled I, II, and III appear to represent the stakeholders or participants in the federated ecosystem, though their specific roles are not defined by text.
### Interpretation
This diagram is a standard representation of the **Federated Averaging (FedAvg)** algorithm.
* **What the data demonstrates:** It demonstrates the decoupling of model training from data storage. By moving the computation to the data (at the client level) rather than moving the data to the computation (at the server level), the system achieves privacy and efficiency.
* **How elements relate:** The relationship is a hub-and-spoke model. The server acts as the central coordinator (hub), and the clients act as the distributed workers (spokes). The flow is bidirectional: weights go up (Step 2), and updated parameters come down (Step 4).
* **Reading between the lines:** The inclusion of the "I", "II", and "III" figures suggests that this process is not just a technical flow but a multi-party interaction. The "Ave." (Average) step is the critical point of the diagram; it is where the "Global model" is synthesized from the diverse experiences of the individual clients. The diagram implies that the global model's intelligence is the sum of the local models' experiences, without the server ever "seeing" the raw data.