## Chart: Energy Consumption of DNNs vs. Humans Over Time
### Overview
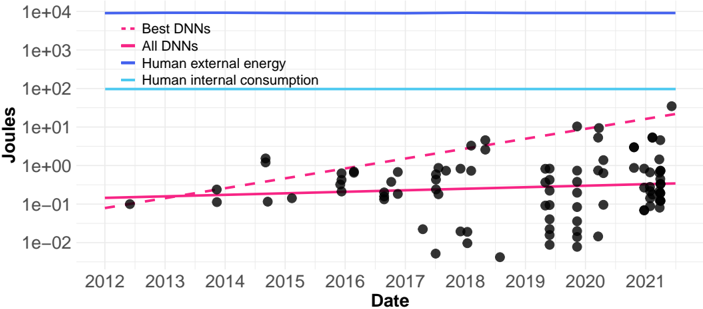
The image is a scatter plot showing the energy consumption (in Joules) of Deep Neural Networks (DNNs) over time (from 2012 to 2021), compared to human energy consumption. The y-axis is logarithmic, ranging from 1e-02 to 1e+04 Joules. The plot includes trend lines for "Best DNNs" and "All DNNs," as well as horizontal lines representing "Human external energy" and "Human internal consumption."
### Components/Axes
* **X-axis:** Date (from 2012 to 2021)
* **Y-axis:** Joules (logarithmic scale from 1e-02 to 1e+04)
* **Legend (top-left):**
* Best DNNs (dashed pink line)
* All DNNs (solid magenta line)
* Human external energy (solid blue line)
* Human internal consumption (solid cyan line)
### Detailed Analysis
* **Best DNNs (dashed pink line):** The trend line slopes upward, indicating an increase in energy consumption over time.
* Approximate value in 2012: 1e-01 Joules
* Approximate value in 2021: 2e+01 Joules
* **All DNNs (solid magenta line):** The trend line is relatively flat, suggesting a stable average energy consumption.
* Approximate value in 2012: 2e-01 Joules
* Approximate value in 2021: 3e-01 Joules
* **Human external energy (solid blue line):** A horizontal line at approximately 1e+04 Joules.
* **Human internal consumption (solid cyan line):** A horizontal line at approximately 1e+02 Joules.
* **Data Points (black dots):** Scattered data points represent individual DNN energy consumption values. The density of points increases significantly from 2019 to 2021. The data points are scattered between 1e-02 and 1e+01 Joules.
### Key Observations
* Energy consumption of "Best DNNs" is increasing over time.
* Average energy consumption of "All DNNs" remains relatively stable.
* Human external energy consumption is significantly higher than DNN energy consumption.
* Human internal consumption is higher than most DNN energy consumption values.
* There is a significant increase in the number of DNN energy consumption data points from 2019 to 2021.
### Interpretation
The chart illustrates the energy consumption trends of DNNs in comparison to human energy consumption. The increasing energy consumption of "Best DNNs" suggests that more complex and computationally intensive models are being developed. The relatively stable average energy consumption of "All DNNs" indicates that many DNNs remain energy-efficient. The comparison to human energy consumption provides context, showing that even the most energy-intensive DNNs consume significantly less energy than human external energy expenditure. The increased density of data points in recent years reflects the growing prevalence and use of DNNs. The data suggests that while the best DNNs are becoming more energy intensive, the average energy consumption of all DNNs is relatively stable, and still significantly lower than human energy consumption.