## Diagram Type: Flowchart
### Overview
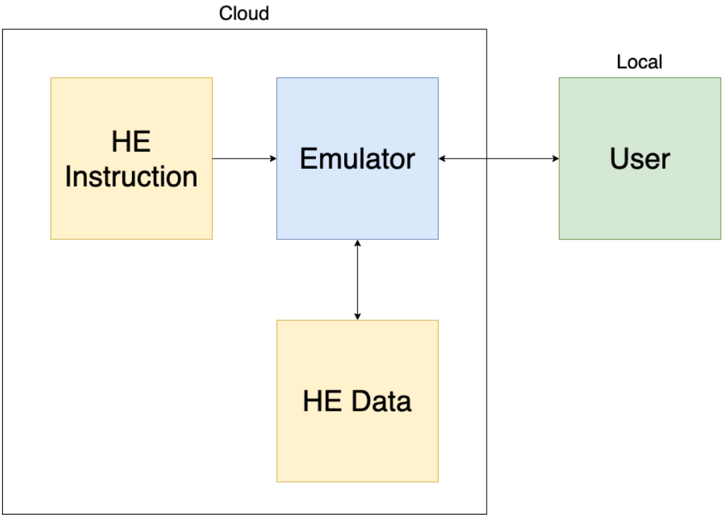
The image is a flowchart that illustrates the process of how HE (High-Energy) instructions are processed and executed. It shows the flow from HE instruction to emulator, then to user, and finally to HE data.
### Components/Axes
- **HE Instruction**: A yellow box representing the high-energy instruction.
- **Emulator**: A blue box representing the emulator that processes the HE instruction.
- **User**: A green box representing the user who interacts with the emulator.
- **HE Data**: A yellow box representing the high-energy data generated by the emulator.
- **Cloud**: A label at the top of the diagram indicating the cloud environment.
- **Local**: A label at the top right of the diagram indicating the local environment.
### Detailed Analysis or ### Content Details
The flowchart shows a linear process where HE instructions are first sent to the emulator. The emulator processes the HE instruction and generates HE data, which is then sent to the user. The user interacts with the emulator, and the process is repeated.
### Key Observations
- The flowchart is simple and clear, making it easy to understand the process.
- The use of different colors for each component helps to distinguish between them.
- The labels "Cloud" and "Local" indicate the different environments in which the process takes place.
### Interpretation
The flowchart demonstrates the process of how HE instructions are processed and executed. It shows that the HE instructions are first sent to the emulator, which processes them and generates HE data. The HE data is then sent to the user, who interacts with the emulator. The process is repeated, indicating that the HE instructions are continuously processed and executed. The use of different colors for each component helps to distinguish between them, making it easy to understand the process. The labels "Cloud" and "Local" indicate the different environments in which the process takes place.