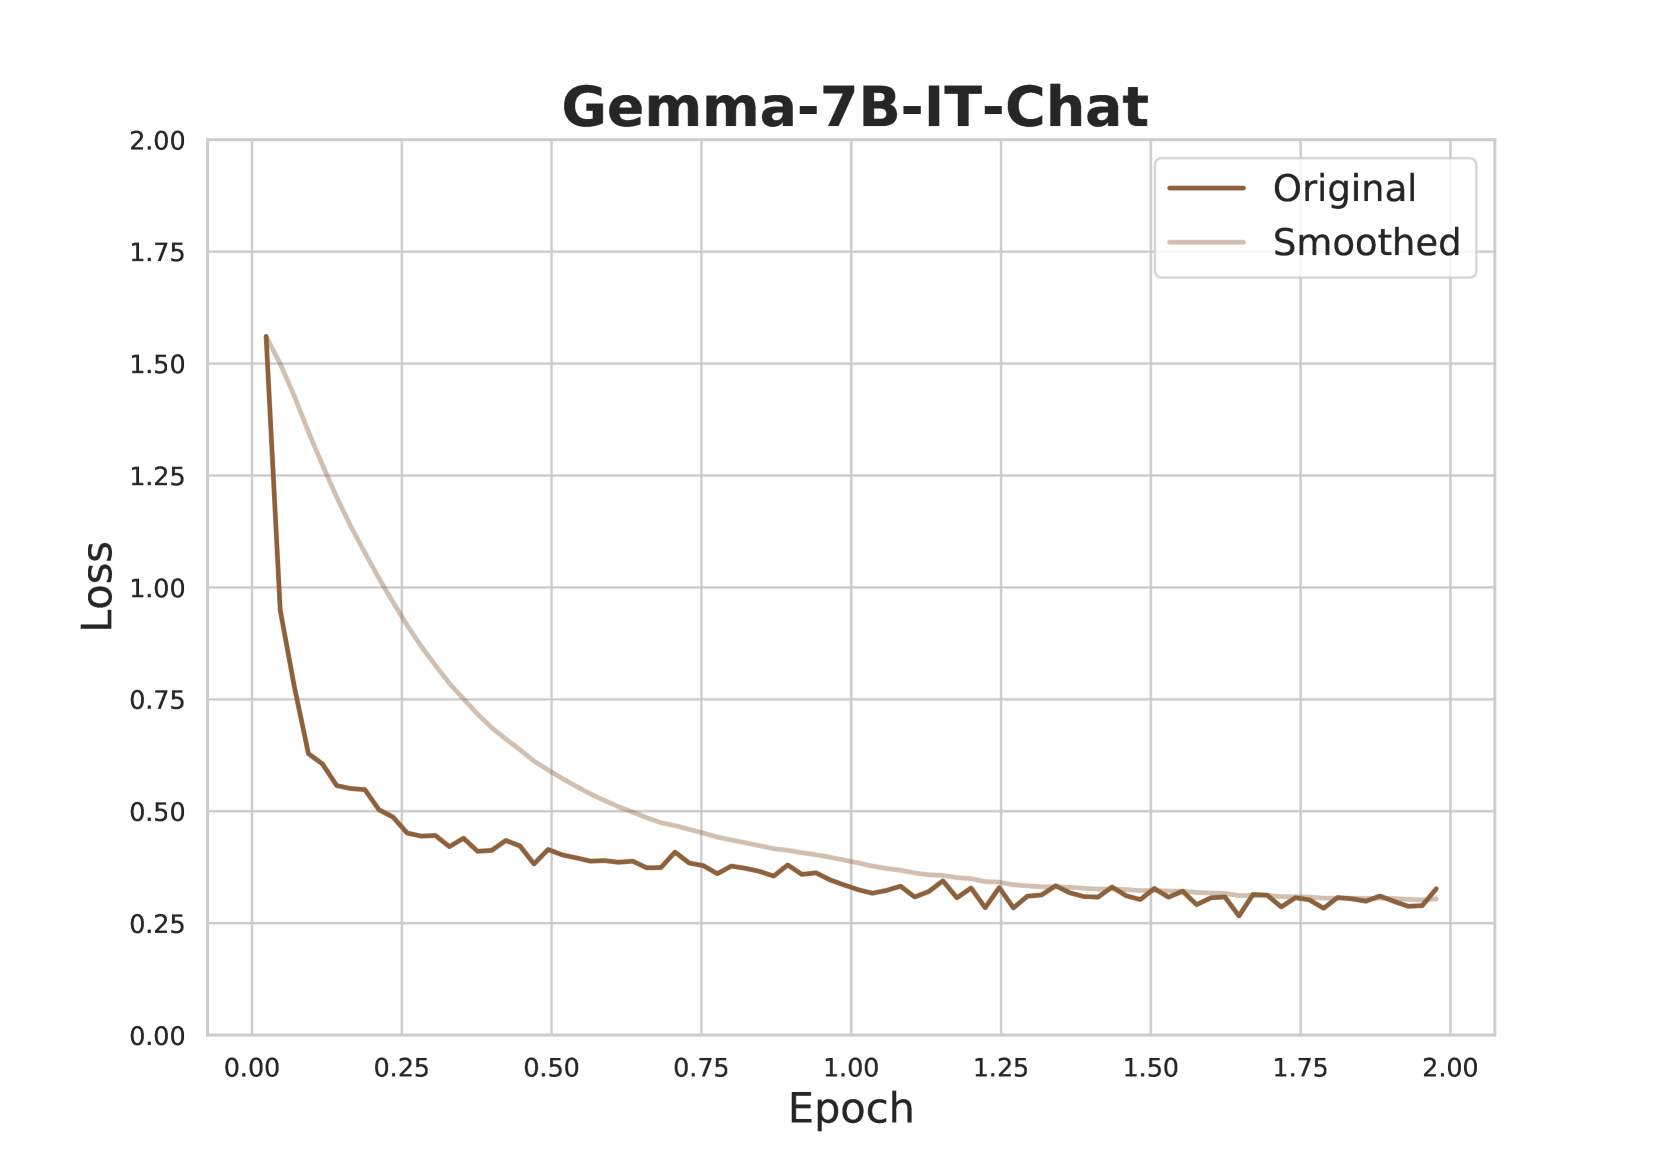
## Line Chart: Gemma-7B-IT-Chat Loss vs. Epoch
### Overview
The image is a line chart displaying the loss of the Gemma-7B-IT-Chat model during training, plotted against the number of epochs. Two lines are shown: the "Original" loss and a "Smoothed" version of the loss. The chart illustrates how the loss decreases over time as the model learns.
### Components/Axes
* **Title:** Gemma-7B-IT-Chat
* **X-axis:** Epoch
* Scale: 0.00 to 2.00, with increments of 0.25
* **Y-axis:** Loss
* Scale: 0.00 to 2.00, with increments of 0.25
* **Legend:** Located in the top-right corner.
* Original (brown line)
* Smoothed (light beige line)
### Detailed Analysis
* **Original Loss (brown line):**
* Trend: Rapidly decreases initially, then plateaus with some fluctuations.
* Data Points:
* Epoch 0.00: Loss ≈ 1.57
* Epoch 0.25: Loss ≈ 0.55
* Epoch 0.50: Loss ≈ 0.42
* Epoch 0.75: Loss ≈ 0.38
* Epoch 1.00: Loss ≈ 0.36
* Epoch 1.25: Loss ≈ 0.30
* Epoch 1.50: Loss ≈ 0.32
* Epoch 1.75: Loss ≈ 0.29
* Epoch 2.00: Loss ≈ 0.30
* **Smoothed Loss (light beige line):**
* Trend: Decreases more smoothly than the original loss, also plateaus.
* Data Points:
* Epoch 0.00: Loss ≈ 1.57
* Epoch 0.25: Loss ≈ 0.95
* Epoch 0.50: Loss ≈ 0.65
* Epoch 0.75: Loss ≈ 0.50
* Epoch 1.00: Loss ≈ 0.40
* Epoch 1.25: Loss ≈ 0.35
* Epoch 1.50: Loss ≈ 0.33
* Epoch 1.75: Loss ≈ 0.31
* Epoch 2.00: Loss ≈ 0.29
### Key Observations
* The "Original" loss fluctuates more than the "Smoothed" loss, indicating that the smoothed line represents a moving average or similar technique to reduce noise.
* Both lines converge to a similar loss value after approximately 1.0 epoch.
* The most significant decrease in loss occurs within the first 0.25 epoch.
### Interpretation
The chart demonstrates the training progress of the Gemma-7B-IT-Chat model. The decreasing loss indicates that the model is learning and improving its performance over time. The "Smoothed" loss provides a clearer picture of the overall trend by filtering out short-term fluctuations. The convergence of both lines suggests that the smoothing method does not significantly alter the final loss value, but rather provides a more stable representation of the learning process. The rapid initial decrease in loss indicates that the model quickly learns the most important patterns in the data, with subsequent epochs resulting in smaller improvements.