## Line Chart: Gemma-7B-IT-Chat Training Loss
### Overview
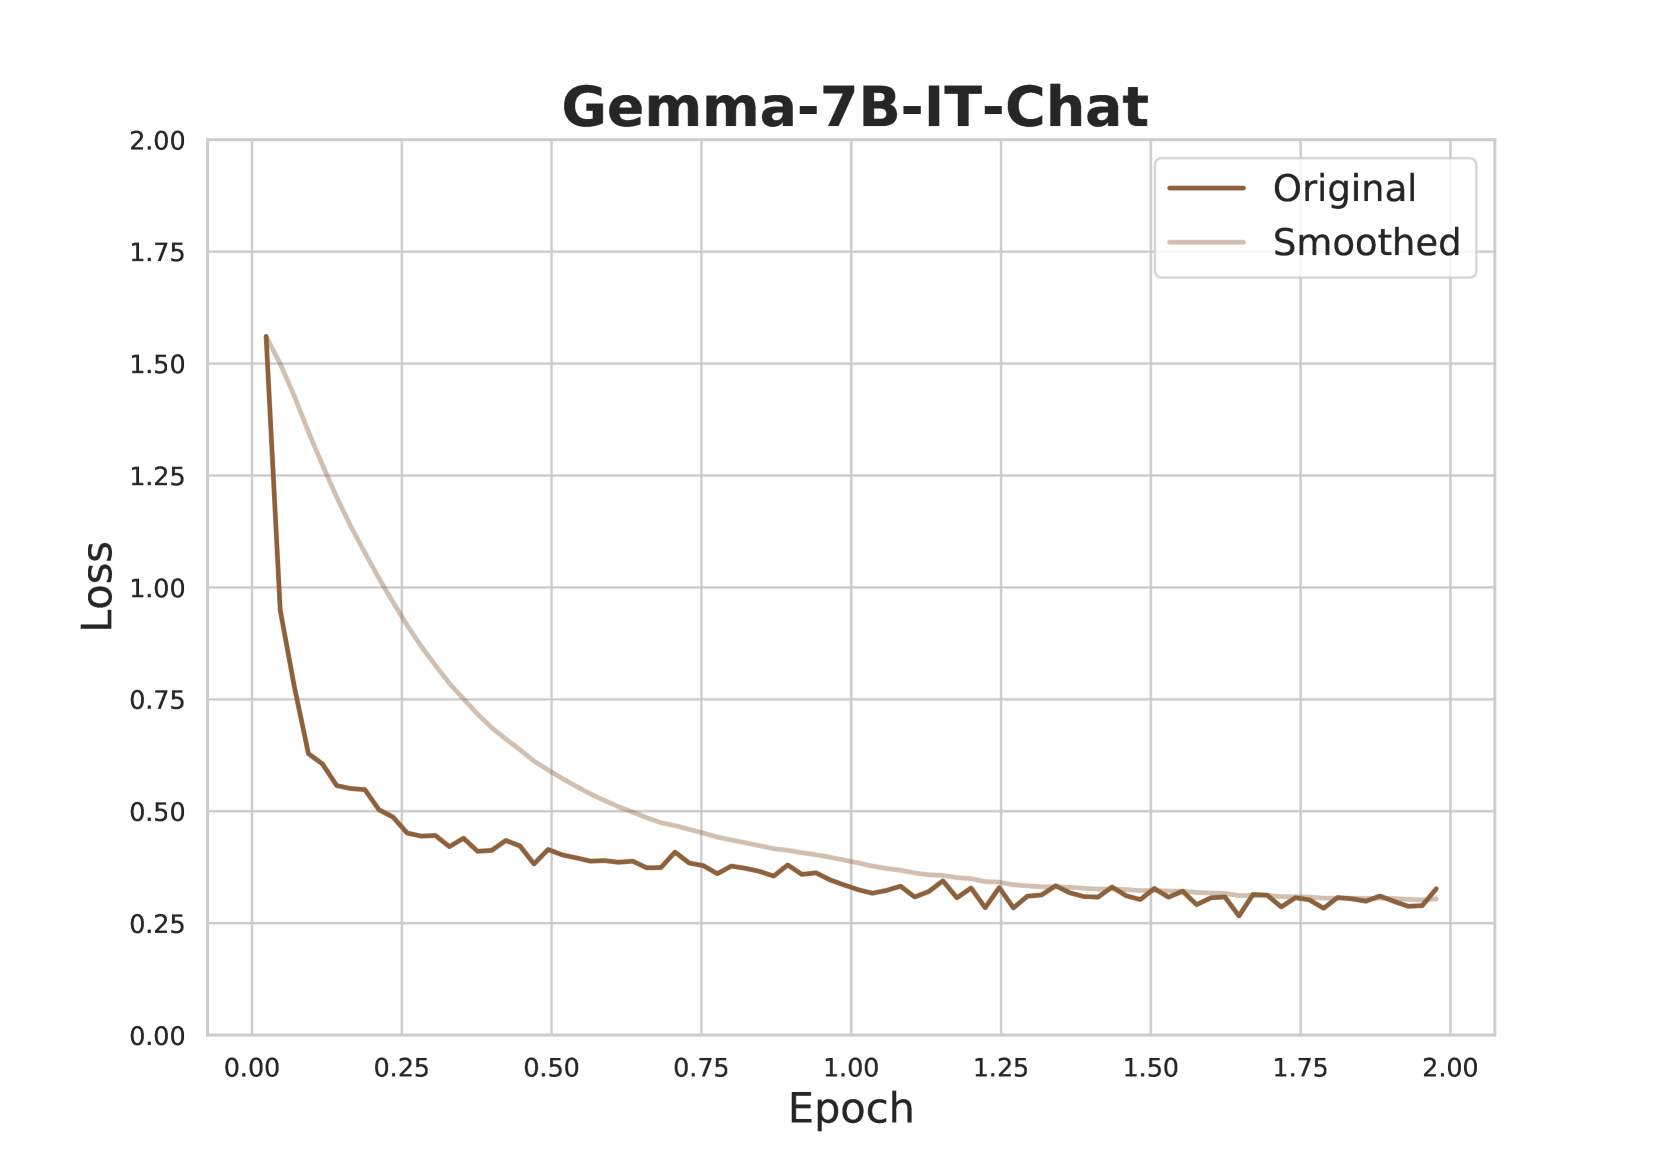
This image presents a line chart illustrating the training loss of the Gemma-7B-IT-Chat model over epochs. Two lines are plotted: "Original" loss and "Smoothed" loss, both representing the loss function's value as training progresses. The chart spans approximately 2 epochs, with loss values ranging from 0.0 to 2.0.
### Components/Axes
* **Title:** Gemma-7B-IT-Chat (positioned at the top-center)
* **X-axis:** Epoch (ranging from 0.0 to 2.0, with tick marks at 0.25 intervals)
* **Y-axis:** Loss (ranging from 0.0 to 2.0, with tick marks at 0.25 intervals)
* **Legend:** Located in the top-right corner, containing two entries:
* "Original" - represented by a dark brown line.
* "Smoothed" - represented by a light brown line.
### Detailed Analysis
The chart displays two lines representing the loss function over epochs.
**Original Loss (Dark Brown Line):**
The line starts at approximately 1.6 at Epoch 0.0. It exhibits a steep downward trend until approximately Epoch 0.25, reaching a value of around 0.6. From Epoch 0.25 to Epoch 1.0, the line continues to decrease, but at a slower rate, reaching a value of approximately 0.35. Between Epoch 1.0 and Epoch 2.0, the line fluctuates around 0.25-0.35, showing minor oscillations.
**Smoothed Loss (Light Brown Line):**
The smoothed line begins at approximately 1.6 at Epoch 0.0, mirroring the original line. It also shows a rapid decrease until Epoch 0.25, reaching a value of around 0.6. From Epoch 0.25 to Epoch 1.0, the smoothed line continues to decrease, reaching a value of approximately 0.3. From Epoch 1.0 to Epoch 2.0, the smoothed line remains relatively stable, fluctuating around 0.25-0.3.
**Specific Data Points (Approximate):**
| Epoch | Original Loss | Smoothed Loss |
|-------|--------------|--------------|
| 0.00 | 1.6 | 1.6 |
| 0.25 | 0.6 | 0.6 |
| 0.50 | 0.45 | 0.4 |
| 0.75 | 0.38 | 0.35 |
| 1.00 | 0.35 | 0.3 |
| 1.25 | 0.32 | 0.28 |
| 1.50 | 0.30 | 0.27 |
| 1.75 | 0.28 | 0.26 |
| 2.00 | 0.25 | 0.25 |
### Key Observations
* Both the original and smoothed loss curves demonstrate a clear decreasing trend, indicating that the model is learning and improving over epochs.
* The smoothed line is less noisy than the original line, providing a clearer visualization of the overall trend.
* The rate of loss reduction slows down after Epoch 0.25, suggesting diminishing returns from further training.
* The loss appears to converge around a value of 0.25-0.35 after Epoch 1.0.
### Interpretation
The chart illustrates the training process of the Gemma-7B-IT-Chat model. The decreasing loss values indicate that the model is successfully minimizing the error between its predictions and the actual values. The smoothing of the loss curve helps to identify the underlying trend, filtering out short-term fluctuations. The convergence of the loss after a certain number of epochs suggests that the model has reached a point of diminishing returns, and further training may not significantly improve its performance. The relatively low final loss value (around 0.25-0.35) indicates that the model has learned a good representation of the training data. This data suggests the model is learning effectively, but further analysis (e.g., validation loss) would be needed to assess generalization performance and prevent overfitting.