## Line Chart: Gemma-7B-IT-Chat Training Loss
### Overview
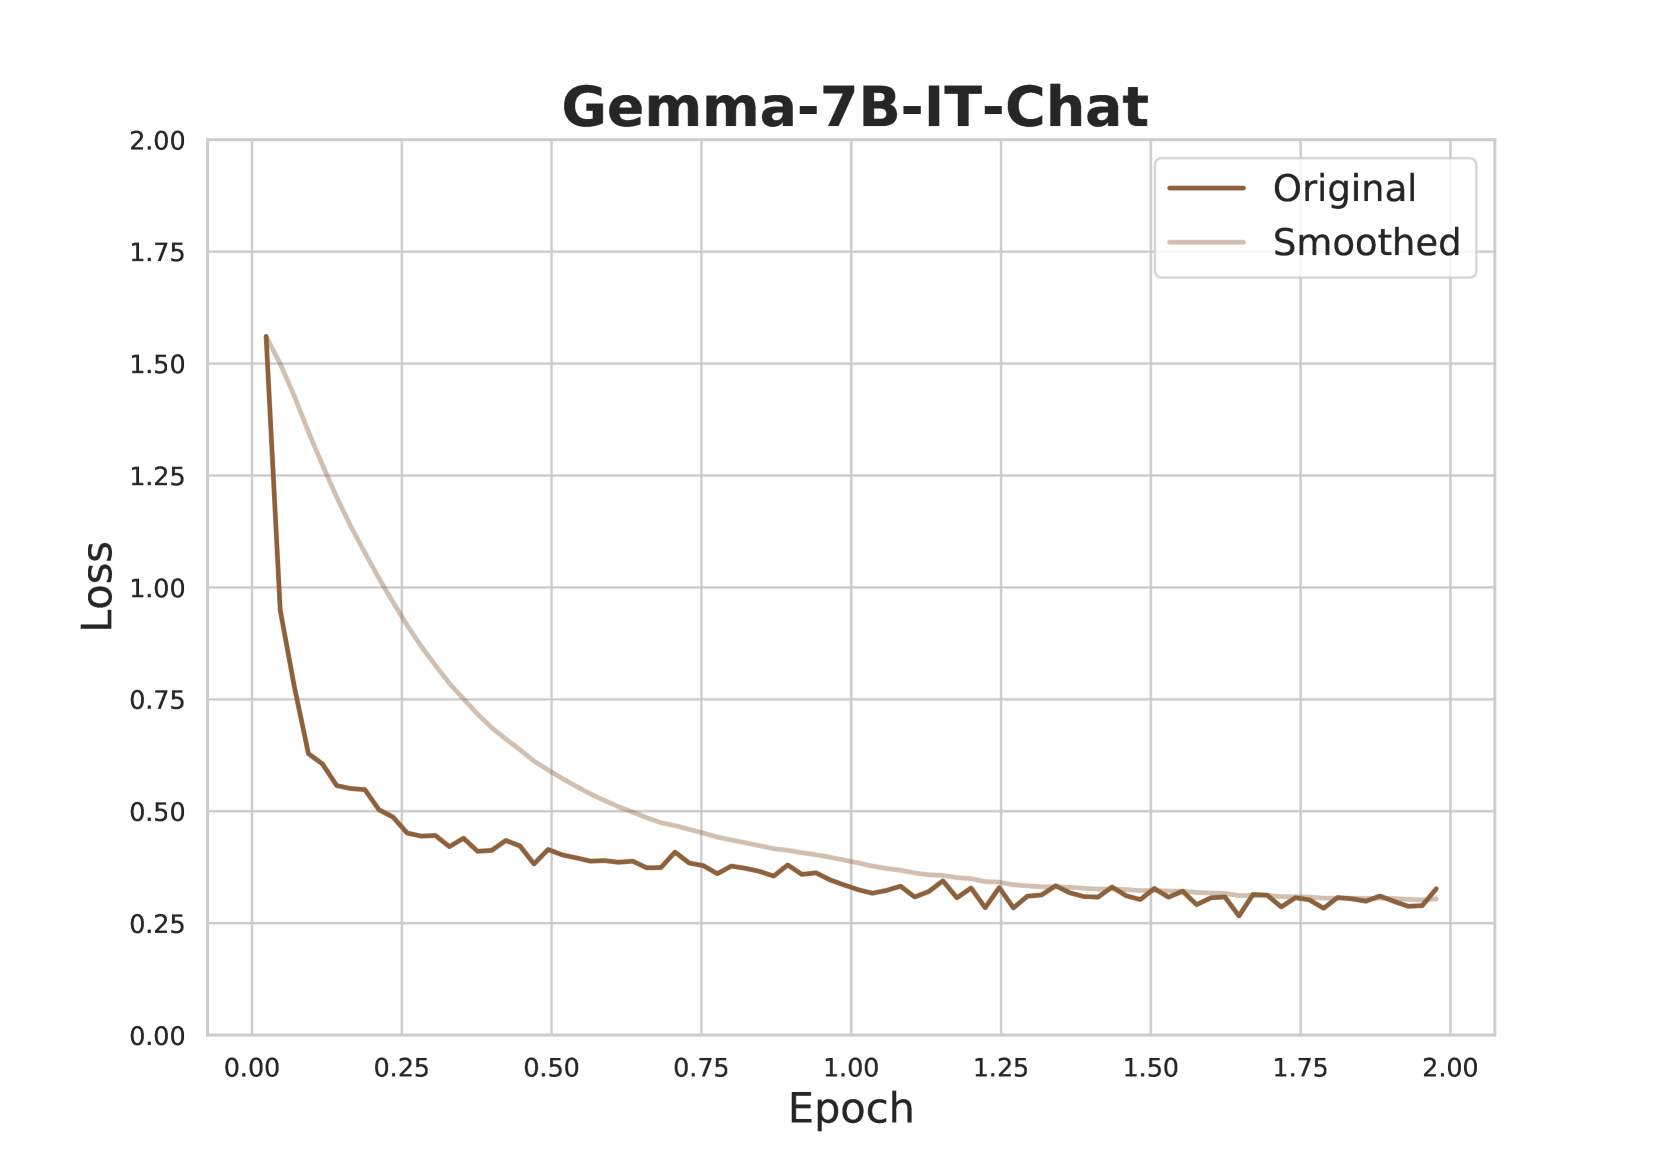
The image is a line chart titled "Gemma-7B-IT-Chat" that plots the training loss of a machine learning model over a series of training epochs. It displays two data series: the raw, fluctuating "Original" loss and a "Smoothed" version of the same data. The chart demonstrates a classic learning curve where loss decreases rapidly at the start of training and then stabilizes.
### Components/Axes
* **Title:** "Gemma-7B-IT-Chat" (centered at the top).
* **Y-Axis:** Labeled "Loss". The scale runs from 0.00 to 2.00, with major gridlines and labels at intervals of 0.25 (0.00, 0.25, 0.50, 0.75, 1.00, 1.25, 1.50, 1.75, 2.00).
* **X-Axis:** Labeled "Epoch". The scale runs from 0.00 to 2.00, with major gridlines and labels at intervals of 0.25 (0.00, 0.25, 0.50, 0.75, 1.00, 1.25, 1.50, 1.75, 2.00).
* **Legend:** Located in the top-right corner of the plot area. It contains two entries:
* A dark brown line labeled "Original".
* A light beige/tan line labeled "Smoothed".
* **Grid:** A light gray grid is present, aligning with the major ticks on both axes.
### Detailed Analysis
**1. "Original" Data Series (Dark Brown Line):**
* **Trend:** The line exhibits a very steep, near-vertical drop at the beginning of training, followed by a rapid deceleration in the rate of decrease. After approximately epoch 0.25, the line enters a phase of gradual decline with noticeable high-frequency fluctuations (noise). From around epoch 1.00 onward, the loss stabilizes, oscillating within a narrow band.
* **Approximate Data Points (with uncertainty):**
* Epoch 0.00: Loss ≈ 1.55
* Epoch 0.05: Loss ≈ 0.65 (sharp drop)
* Epoch 0.25: Loss ≈ 0.45
* Epoch 0.50: Loss ≈ 0.40
* Epoch 1.00: Loss ≈ 0.30
* Epoch 1.50: Loss ≈ 0.28
* Epoch 2.00: Loss ≈ 0.30 (slight uptick at the very end)
**2. "Smoothed" Data Series (Light Beige Line):**
* **Trend:** This line represents a smoothed version of the "Original" data, likely using a moving average or similar filter. It shows a smooth, convex curve that decreases monotonically. The rate of decrease is fastest initially and slows over time, asymptotically approaching a stable value.
* **Approximate Data Points (with uncertainty):**
* Epoch 0.00: Loss ≈ 1.55 (coincides with Original start)
* Epoch 0.25: Loss ≈ 0.90
* Epoch 0.50: Loss ≈ 0.60
* Epoch 0.75: Loss ≈ 0.45
* Epoch 1.00: Loss ≈ 0.35
* Epoch 1.50: Loss ≈ 0.28
* Epoch 2.00: Loss ≈ 0.27
**Spatial Relationship:** The "Smoothed" line consistently lies above the "Original" line during the initial rapid descent phase (epochs 0.00 to ~0.75), as the smoothing algorithm lags behind the sharp drop. The two lines converge and become nearly indistinguishable from approximately epoch 1.25 onward, both hovering around a loss value of 0.25-0.30.
### Key Observations
1. **Rapid Initial Learning:** The most significant reduction in loss occurs within the first 0.25 epochs, indicating the model quickly learns the most prominent patterns in the training data.
2. **Convergence and Stabilization:** Both lines show clear convergence. The loss stabilizes after epoch 1.00, suggesting the model has reached a plateau in its learning for this training run.
3. **Noise in Raw Signal:** The "Original" line contains significant high-frequency noise, which is typical of stochastic gradient descent-based training. The "Smoothed" line effectively removes this noise to reveal the underlying trend.
4. **Final Value:** The training loss stabilizes at a value of approximately 0.28 ± 0.02.
### Interpretation
This chart visualizes the training dynamics of the "Gemma-7B-IT-Chat" model. The steep initial drop signifies effective early-stage learning. The subsequent plateau indicates that further training beyond 1.5-2.0 epochs, with the current setup (data, learning rate, etc.), may yield diminishing returns, as the model's performance on the training set (as measured by loss) is no longer improving significantly.
The presence of noise in the "Original" signal is not an anomaly but a characteristic of the training process. The "Smoothed" line is crucial for interpreting the true learning trajectory, filtering out the batch-to-batch variance. The convergence of both lines at a low, stable loss value suggests the training process was stable and the model successfully fit the training data to the limit of its capacity or the provided optimization parameters. To assess if this loss value is "good," one would need to compare it to validation loss metrics, which are not shown here.