## Line Chart: Gemma-7B-IT-Chat Loss Over Epochs
### Overview
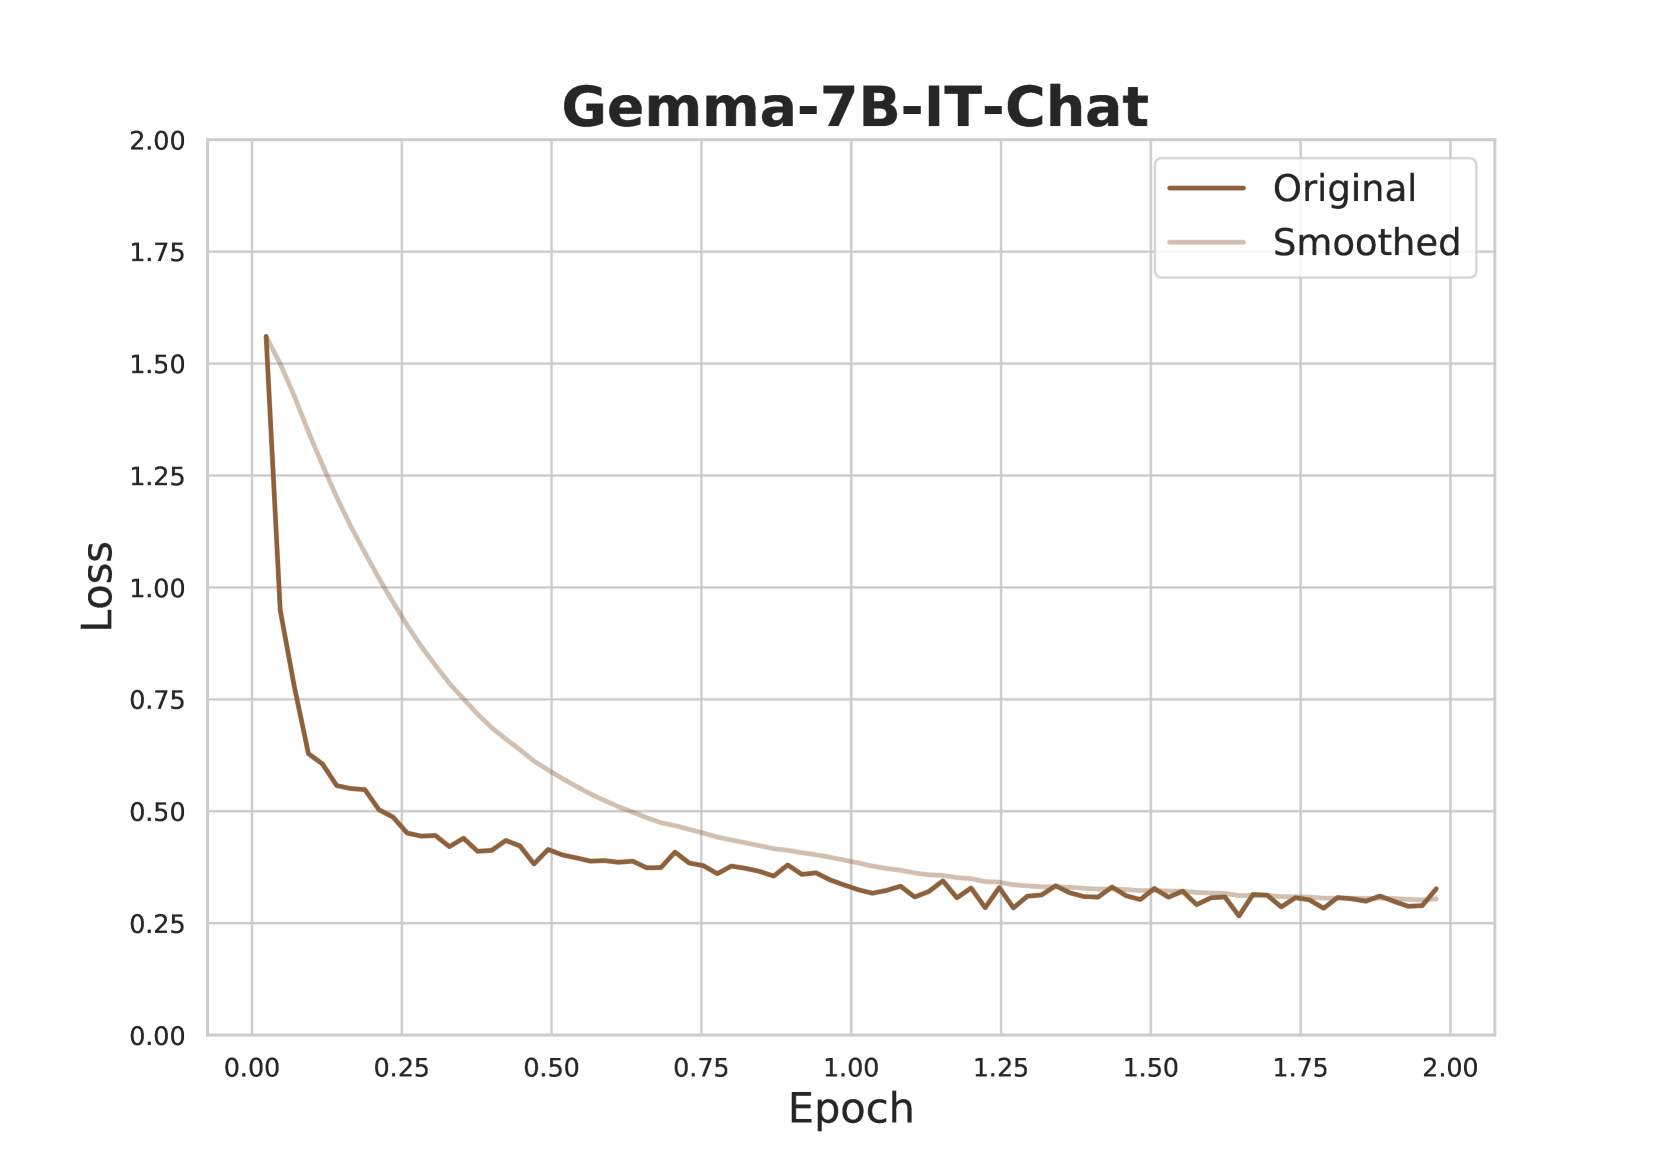
The chart visualizes the training loss of the Gemma-7B-IT-Chat model across 2.00 epochs. Two data series are plotted: "Original" (dark brown line) and "Smoothed" (light brown line). Both lines show a general decline in loss, with the "Smoothed" line exhibiting less volatility.
### Components/Axes
- **Title**: "Gemma-7B-IT-Chat" (top-center)
- **X-axis**: "Epoch" (0.00 to 2.00, increments of 0.25)
- **Y-axis**: "Loss" (0.00 to 2.00, increments of 0.25)
- **Legend**: Top-right corner, labels:
- Dark brown: "Original"
- Light brown: "Smoothed"
### Detailed Analysis
1. **Original Line**:
- Starts at **~1.55 loss** at epoch 0.00.
- Sharp decline to **~0.35 loss** by epoch 0.50.
- Fluctuates slightly between **0.30–0.40 loss** from epoch 0.50 to 2.00.
- Ends at **~0.30 loss** at epoch 2.00.
2. **Smoothed Line**:
- Starts at **~1.50 loss** at epoch 0.00.
- Gradual decline to **~0.30 loss** by epoch 2.00.
- Minimal fluctuations, maintaining a steady downward trend.
### Key Observations
- The "Original" line shows significant early volatility, dropping rapidly in the first 0.50 epochs.
- The "Smoothed" line reduces noise, providing a clearer view of the overall loss trend.
- Both lines converge near the end, ending at similar loss values (~0.30).
### Interpretation
The data suggests that the model's loss decreases over epochs, with the smoothing technique mitigating short-term fluctuations. This indicates that while the "Original" line captures raw training dynamics, the "Smoothed" line better reflects the model's long-term performance trajectory. The convergence at epoch 2.00 implies both methods achieve comparable final performance, though smoothing stabilizes the loss measurement.