# Technical Diagram Analysis
## Diagram Structure
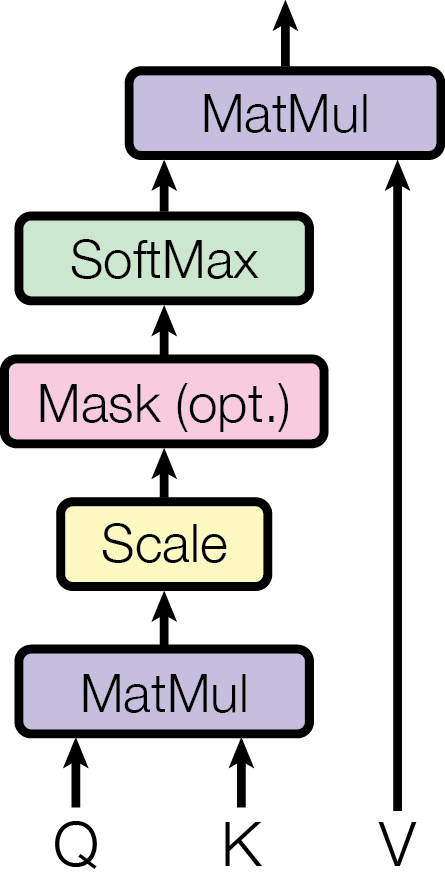
The image depicts a computational flow diagram with the following components:
### Key Components
1. **MatMul (Matrix Multiplication)**
- Appears twice in the diagram:
- Top MatMul (purple)
- Bottom MatMul (purple)
- Connected by vertical arrows
2. **SoftMax**
- Green rectangle
- Positioned between top MatMul and Mask
3. **Mask (opt.)**
- Pink rectangle
- Optional component (denoted by "(opt.)")
- Located between SoftMax and Scale
4. **Scale**
- Yellow rectangle
- Positioned between Mask and bottom MatMul
### Inputs
- **Q** (Query)
- **K** (Key)
- **V** (Value)
- All inputs connect to bottom MatMul
- V has a direct connection to top MatMul
## Data Flow
1. **Bottom Path**
- Q → Bottom MatMul → Scale → Mask (opt.) → SoftMax → Top MatMul
2. **Direct Path**
- V → Top MatMul
## Color Coding
- Purple: MatMul operations
- Green: SoftMax
- Pink: Optional Mask
- Yellow: Scale
## Spatial Grounding
- Top MatMul: [x, y] = [center, top]
- SoftMax: [x, y] = [center, middle-top]
- Mask: [x, y] = [center, middle]
- Scale: [x, y] = [center, middle-bottom]
- Bottom MatMul: [x, y] = [center, bottom]
- Q/K/V: [x, y] = [left/center/right, bottom]
## Component Isolation
1. **Header**: Top MatMul
2. **Main Chart**:
- SoftMax → Mask → Scale → Bottom MatMul
3. **Footer**: Inputs (Q, K, V)
## Flow Verification
- All arrows indicate unidirectional data flow
- Optional Mask component allows bypassing
- V input bypasses bottom MatMul and connects directly to top MatMul
## Notes
- No numerical data or trends present
- Diagram represents a typical attention mechanism flow
- Optional Mask suggests conditional processing capability